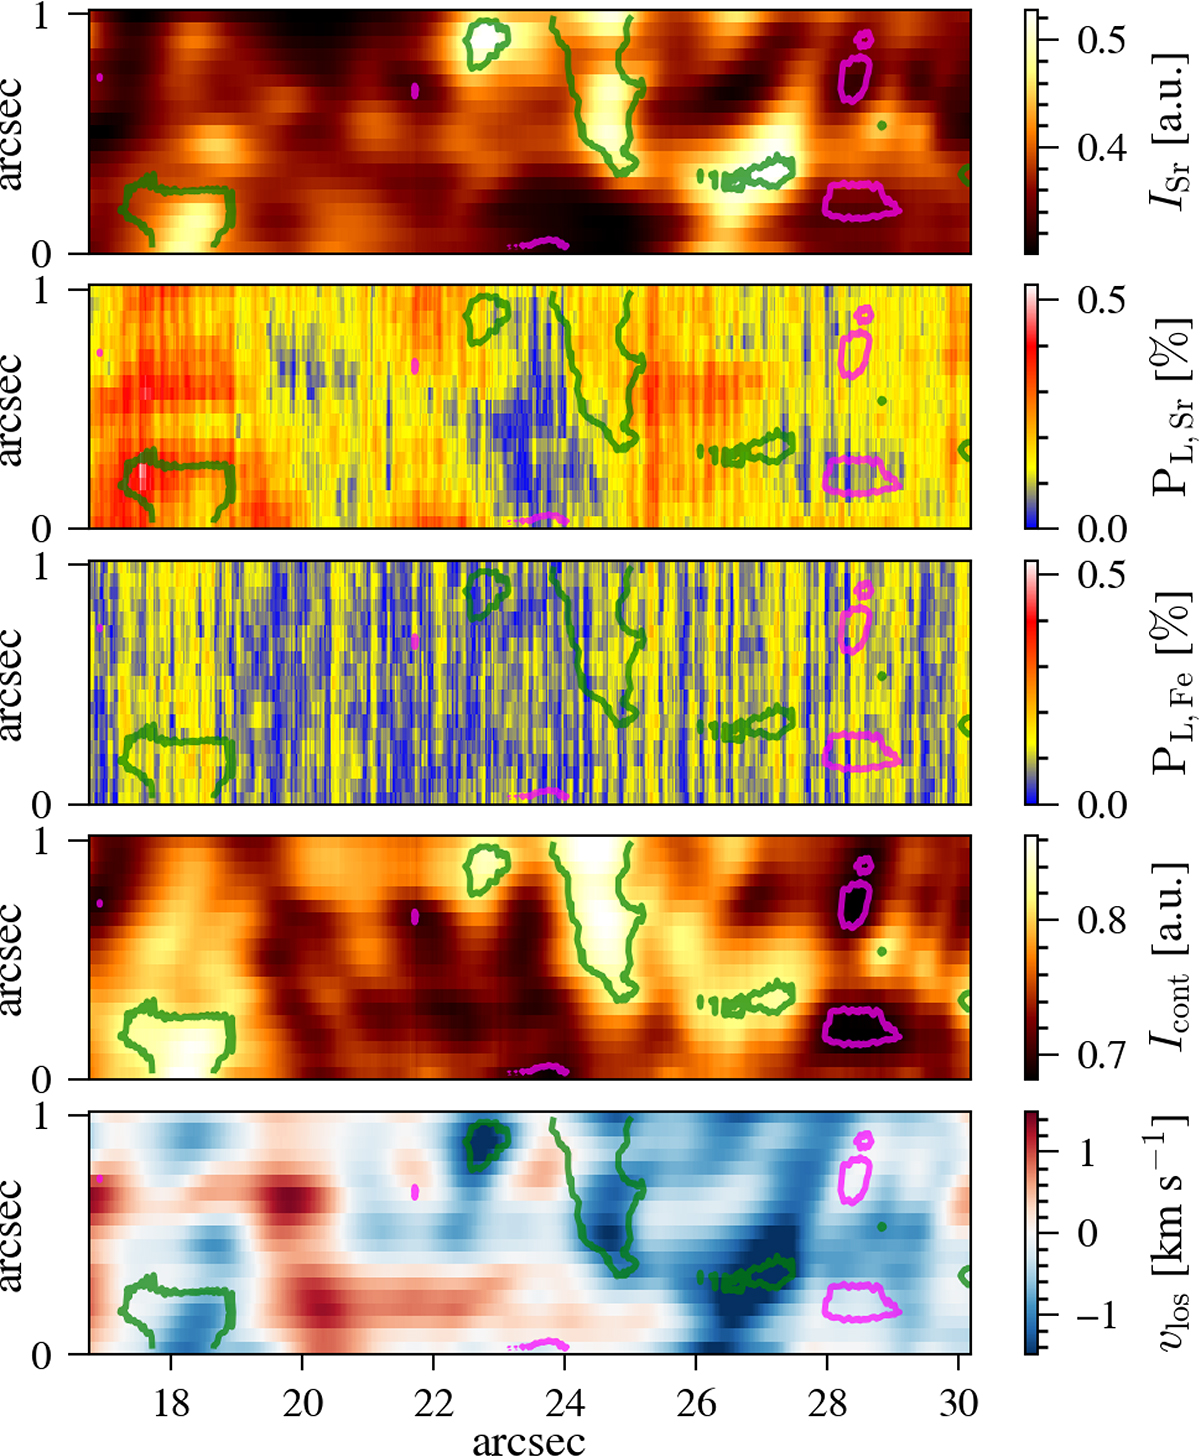
Fig. C.1.
Download original image
Intensity in Sr I (top) and total linear polarization maps (as explained in the main text) in Sr I, in Fe I (second and third panel, respectively), continuum intensity (second last panel) and LOS velocity (bottom panel) at μ = 0.74. Note the displayed region is a cutout from the full scan presented in Fig. 5, covering 13″. Contour colors are corresponding to the continuum intensity thresholds given in Fig. 6, separating dark (magenta lines) and bright (green lines) pixels.
Current usage metrics show cumulative count of Article Views (full-text article views including HTML views, PDF and ePub downloads, according to the available data) and Abstracts Views on Vision4Press platform.
Data correspond to usage on the plateform after 2015. The current usage metrics is available 48-96 hours after online publication and is updated daily on week days.
Initial download of the metrics may take a while.