Fig. 4.
Download original image
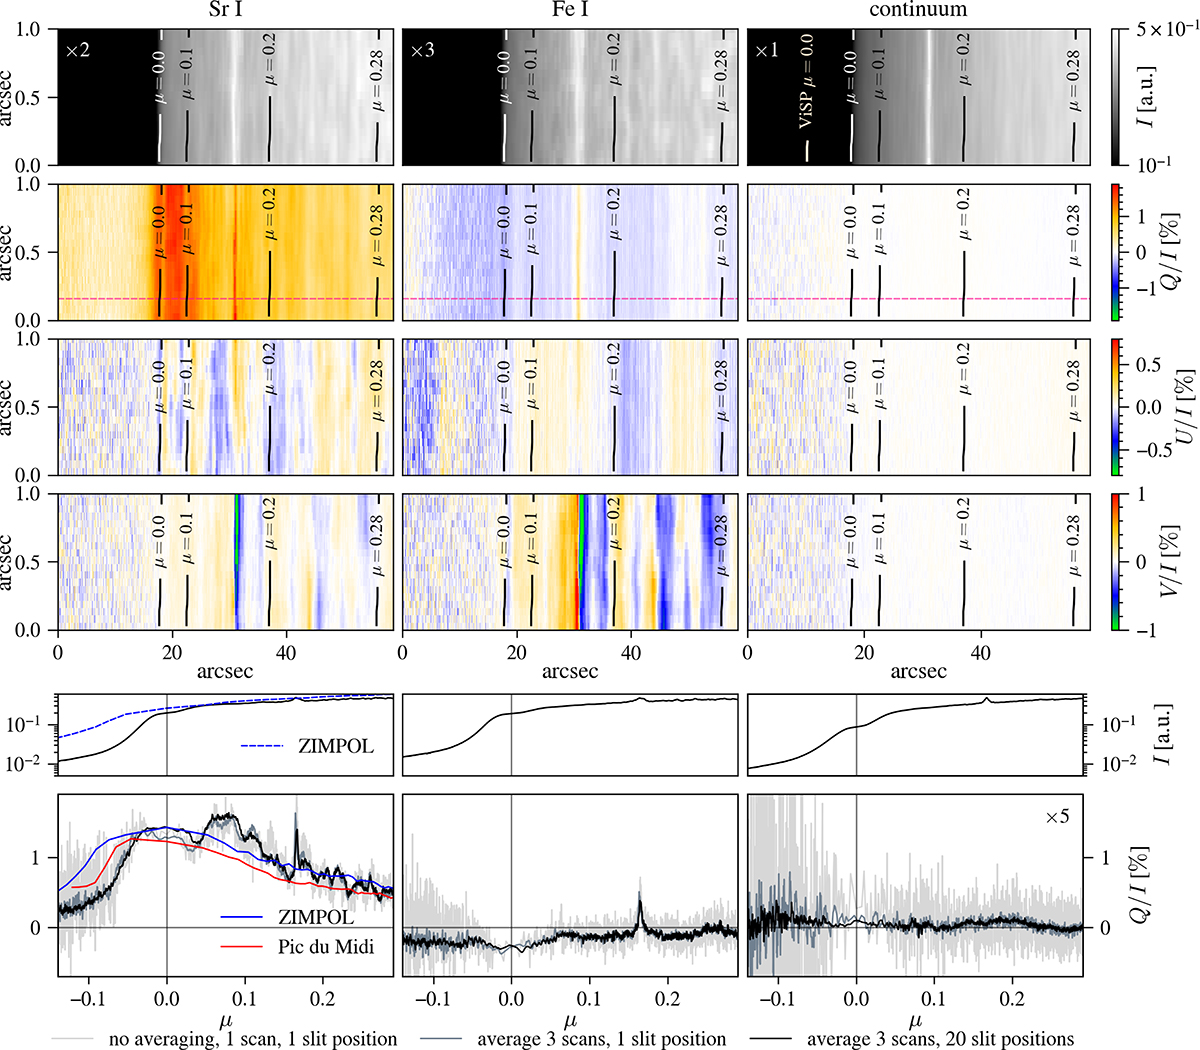
Four upper rows: Full Stokes maps for Sr I (left column), Fe I (central column), and the continuum (right column), averaged over all three scans and spatially binned to 0![]() 1 × 0
1 × 0![]() 1 sampling. The intensity and linear polarization is plotted for the spectral line core wavelength positions, while the circular polarization was taken at a small wavelength offset in the red wing (see Fig. 2 for the offset). Each Stokes parameter has the same scale, shown on the right. The intensity is scaled by the factor given in the upper left of the intensity panel. Limb distance contours are given. The limb (μ = 0) is given by the inflection point of the continuum intensity. We also show the approximate position of μ = 0 determined from the ViSP coordinates in the continuum intensity image. Bottom rows: Center-to-limb variation for the intensity and linear polarization parallel to the limb. Note that the continuum polarization is scaled by a factor of five. Reference low spatio-temporal resolution Sr I data (Zeuner et al. 2022; Malherbe 2025) are shown in dark blue and red; see text for details. Note that the intensity is plotted on a logarithmic scale.
1 sampling. The intensity and linear polarization is plotted for the spectral line core wavelength positions, while the circular polarization was taken at a small wavelength offset in the red wing (see Fig. 2 for the offset). Each Stokes parameter has the same scale, shown on the right. The intensity is scaled by the factor given in the upper left of the intensity panel. Limb distance contours are given. The limb (μ = 0) is given by the inflection point of the continuum intensity. We also show the approximate position of μ = 0 determined from the ViSP coordinates in the continuum intensity image. Bottom rows: Center-to-limb variation for the intensity and linear polarization parallel to the limb. Note that the continuum polarization is scaled by a factor of five. Reference low spatio-temporal resolution Sr I data (Zeuner et al. 2022; Malherbe 2025) are shown in dark blue and red; see text for details. Note that the intensity is plotted on a logarithmic scale.
Current usage metrics show cumulative count of Article Views (full-text article views including HTML views, PDF and ePub downloads, according to the available data) and Abstracts Views on Vision4Press platform.
Data correspond to usage on the plateform after 2015. The current usage metrics is available 48-96 hours after online publication and is updated daily on week days.
Initial download of the metrics may take a while.