Fig. 6.
Download original image
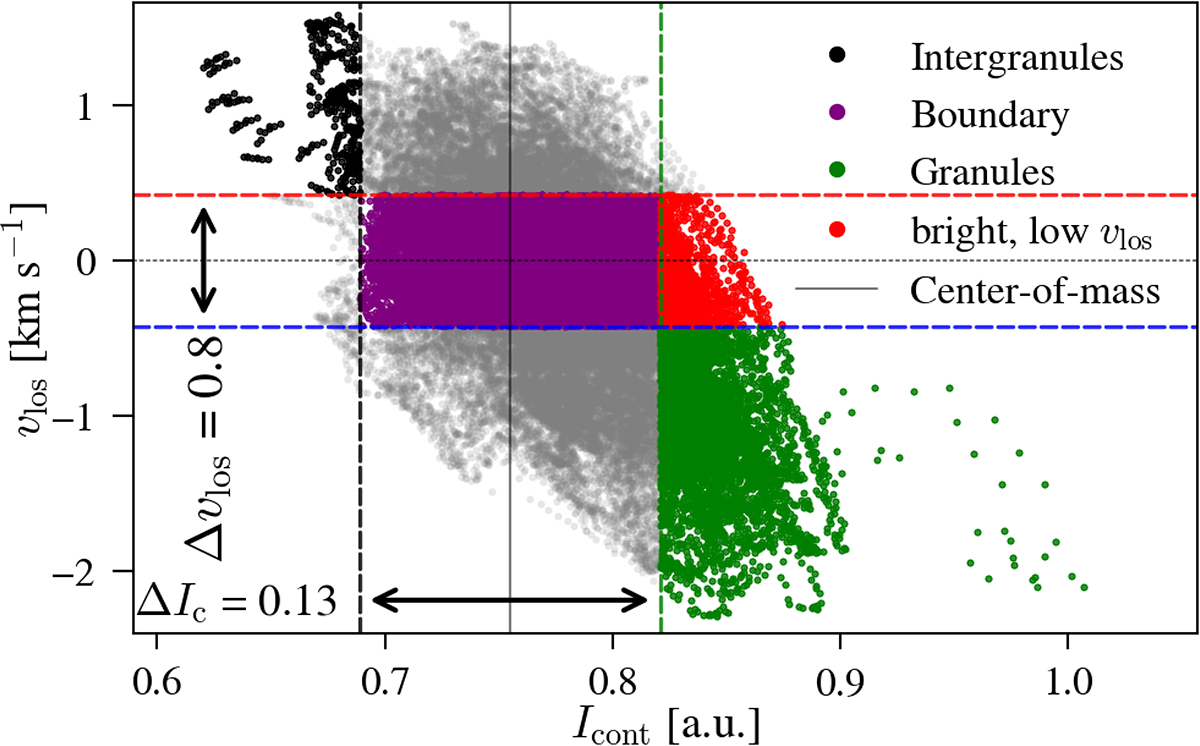
Scatter plot of the continuum intensity and LOS velocity estimated from Sr I for μ = 0.74. Vertical dashed black and green lines indicate the positions of the intensity thresholds for the intergranules and granules, respectively. Horizontal dashed red and blue lines indicate the LOS velocity thresholds for intergranules and granules, respectively. The choice of the thresholds are given in the main text.
Current usage metrics show cumulative count of Article Views (full-text article views including HTML views, PDF and ePub downloads, according to the available data) and Abstracts Views on Vision4Press platform.
Data correspond to usage on the plateform after 2015. The current usage metrics is available 48-96 hours after online publication and is updated daily on week days.
Initial download of the metrics may take a while.