Open Access
Fig. 8.
Download original image
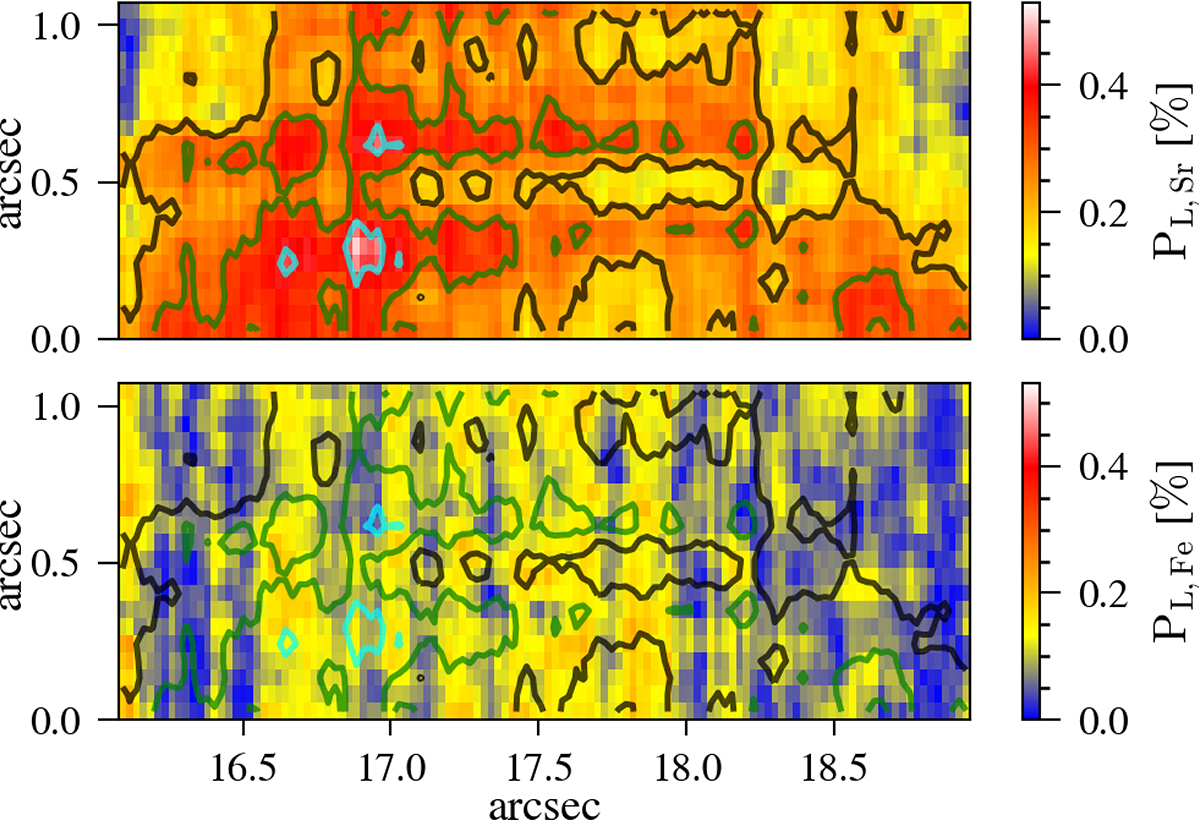
Total linear polarization maps for Sr I (upper panel) and Fe I (lower panel) with contours at the S/N = PL, Sr, b/σSr, bP levels 2, 3, and 4, indicated by the line colors black, green, and cyan, respectively, for a detailed region of Fig. 5 at μ = 0.74.
Current usage metrics show cumulative count of Article Views (full-text article views including HTML views, PDF and ePub downloads, according to the available data) and Abstracts Views on Vision4Press platform.
Data correspond to usage on the plateform after 2015. The current usage metrics is available 48-96 hours after online publication and is updated daily on week days.
Initial download of the metrics may take a while.