Fig. 3
Download original image
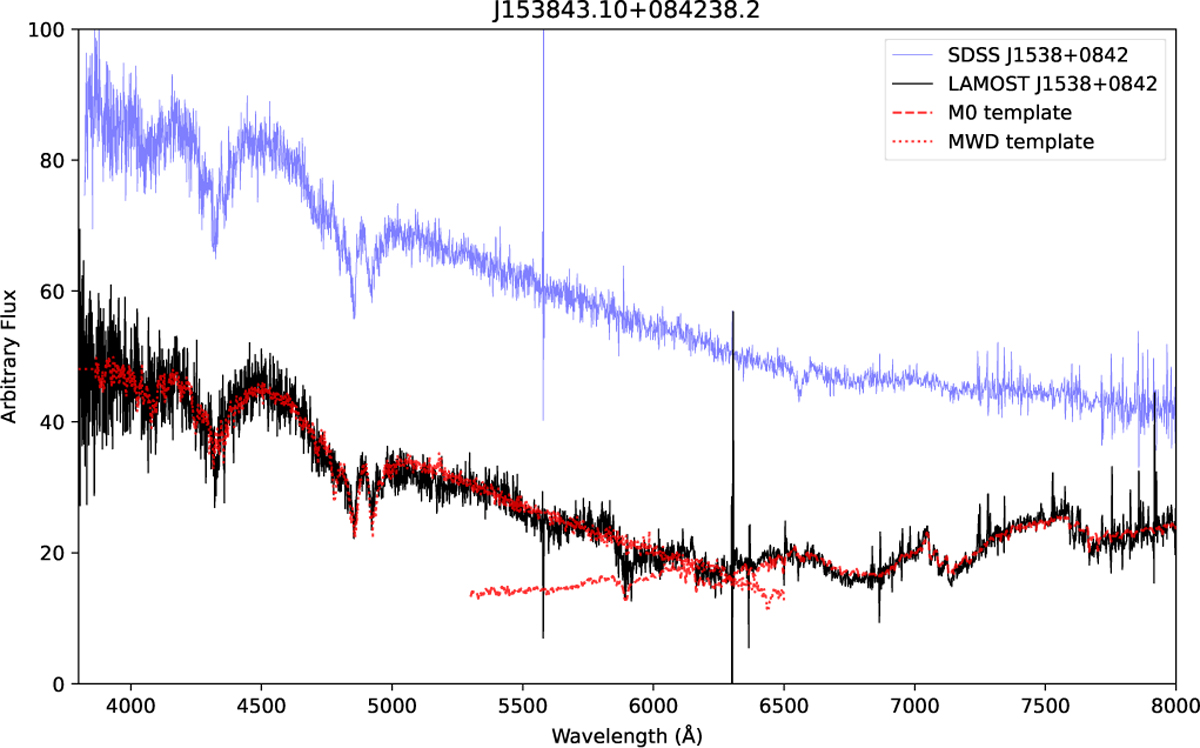
Composite spectral analysis of J1538+0842. The LAMOST spectrum (black) is compared with an MWD template with a surface field of B ≈ 12 MG (dotted red line) and an M0 star template (dashed red line). While the MWD template fits the Zeeman-split Balmer lines in the blue channel (λ < 6500 Å), the M0 template is required to reproduce the molecular bands in the red channel (λ > 5500 Å). In contrast, the SDSS spectrum of the same target (blue), scaled for comparison, shows no significant M star features in the red channel.
Current usage metrics show cumulative count of Article Views (full-text article views including HTML views, PDF and ePub downloads, according to the available data) and Abstracts Views on Vision4Press platform.
Data correspond to usage on the plateform after 2015. The current usage metrics is available 48-96 hours after online publication and is updated daily on week days.
Initial download of the metrics may take a while.