| Issue |
A&A
Volume 708, April 2026
|
|
|---|---|---|
| Article Number | A275 | |
| Number of page(s) | 7 | |
| Section | Catalogs and data | |
| DOI | https://doi.org/10.1051/0004-6361/202557083 | |
| Published online | 14 April 2026 | |
Searching for magnetic white dwarfs in LAMOST DR10
1
Space Physics and Astronomy research unit,
PO Box 3000,
90014
University of Oulu,
Finland
2
Key Laboratory of Space Astronomy and Technology, National Astronomical Observatories, Chinese Academy of Sciences,
Beijing
100101,
China
3
Key Laboratory of Optical Astronomy, National Astronomical Observatories, Chinese Academy of Sciences,
Beijing
100101,
China
4
Department of Physics,
PO Box 64,
00014
University of Helsinki, Helsinki,
Finland
★ Corresponding author: This email address is being protected from spambots. You need JavaScript enabled to view it.
Received:
2
September
2025
Accepted:
8
March
2026
Abstract
Aims. Magnetic white dwarfs (MWDs) are key to understanding the origin and evolution of magnetic fields in compact stars. While large spectroscopic surveys such as SDSS have greatly expanded the known sample, the potential of LAMOST has not yet been fully explored. Our aim is to identify and characterize isolated MWDs in the LAMOST data release ten (DR10).
Methods. We crossmatched LAMOST DR10 spectra with white dwarf candidates from Gaia early data release three (EDR3) and with recent SDSS-based catalogs of MWDs. Zeeman splitting in Balmer and helium absorption lines was used as the primary diagnostic to identify magnetic fields and to estimate their strengths. Reference objects from the SDSS catalogs were used to test the detectability of MWDs in LAMOST low-resolution spectra.
Results. We identified 63 isolated MWDs in LAMOST DR10, 32 of which are new discoveries. Surface magnetic field strengths were measured from Zeeman splitting, covering a range from a few megagauss up to several tens. For previously known SDSS MWDs, our LAMOST-based field measurements mostly show agreement with published values.
Conclusions. This work demonstrates the capability of LAMOST low-resolution spectroscopy to identify and characterize isolated MWDs. The newly discovered objects expand the known population and provide valuable targets for future high-resolution spectroscopic and polarimetric follow-up studies. Our results highlight the potential of combining LAMOST with Gaia and other large surveys to build a more complete census of MWDs.
Key words: catalogs / surveys / white dwarfs
© The Authors 2026
 Open Access article, published by EDP Sciences, under the terms of the Creative Commons Attribution License (https://creativecommons.org/licenses/by/4.0), which permits unrestricted use, distribution, and reproduction in any medium, provided the original work is properly cited.
This article is published in open access under the Subscribe to Open model. This email address is being protected from spambots. You need JavaScript enabled to view it. to support open access publication.
1 Introduction
Magnetic white dwarfs (MWDs) are a fascinating subset of white dwarf (WD) stars. Their magnetic field strengths span a broad range, from 104 G to above 109 G (Ferrario et al. 2015), and they are typically detected via Zeeman splitting of spectral lines, cyclotron radiations, or (in some cases) polarization signatures. Isolated MWDs are thought to originate through a range of evolutionary pathways, including single-star evolution (Angel et al. 1985), binary interactions during common-envelope evolution (Tout et al. 2008; Schreiber et al. 2021), or WD–WD mergers (Garcia-Berro et al. 2012). However, there is a long-standing question regarding the origin of the magnetic field, namely, whether it is a fossil remnant from the progenitor star (e.g., Ap or Bp type) or something that is generated or amplified during late stages of stellar evolution.
Statistically, ~10–20% of all WDs are magnetic (Kepler et al. 2013; Ferrario et al. 2015), though this fraction may be underestimated due to selection biases. Isolated MWDs tend to be more massive than their non-magnetic counterparts (Shaw et al. 2020), suggesting either a merger origin or more massive progenitors. Population synthesis studies have sought to reconcile the observed mass distribution and field strengths with these formation channels, but no consensus has been reached.
The catalog of MWDs has expanded significantly in recent years, primarily thanks to large-scale spectroscopic surveys. The Sloan Digital Sky Survey (SDSS; York et al. 2000) has played a particularly important role, having led to an exponential increase in the number of known MWDs (Gänsicke et al. 2002; Schmidt et al. 2003; Vanlandingham et al. 2005; Külebi et al. 2009; Kepler et al. 2013; Ferrario et al. 2015). The most recent SDSS-based catalogs report over 800 MWDs, including both hydrogen-rich (DAH) and helium-rich (DBH) types (Kepler et al. 2013; Amorim et al. 2023; Hardy et al. 2023), enabling detailed statistical studies of their properties.
We conducted a systematic search for MWDs using the low-resolution spectroscopic (LRS) database provided by the Large Sky Area Multi-Object Fiber Spectroscopic Telescope (LAMOST). By crossmatching its data release ten (DR10) with existing WD catalogs and employing Zeeman splitting as the main diagnostic, we identified and measured the surface magnetic field strengths of 63 isolated MWDs with 78 spectra in the LAMOST database, including 38 spectra of 32 newly discovered objects. This sample both complements and extends previous SDSS-based studies, and it demonstrates the ability of LAMOST to contribute significantly to the census of MWDs.
2 LAMOST spectroscopy
LAMOST, also known as the Guo Shoujing Telescope, is a quasi-meridian reflecting Schmidt telescope with an effective aperture of approximately 4 meters and a wide field of view of 5 degrees (Wang et al. 1996; Su & Cui 2004; Cui et al. 2012). Located at the Xinglong Station of the National Astronomical Observatories, Chinese Academy of Sciences, LAMOST is equipped with 4000 optical fibers distributed across its focal plane. Each fiber is connected to one of 16 spectrographs, enabling the simultaneous acquisition of over 4000 spectra per exposure. Each spectrograph includes two CCD (charge-coupled device) cameras covering both blue and red wavelength channels. The LAMOST spectral range spans from 3700 Å to 9000 Å, with a resolving power of R ~ 1800. The raw data collected during the survey were processed using the LAMOST 2D pipeline (Bai et al. 2017b,a). This pipeline performs dark and bias subtraction, cosmic ray removal, 1D spectral extraction, co-addition of sub-exposures (each plate is typically observed at least three times), and stitching of the blue and red channel spectra. The resulting combined spectra were then passed through the LAMOST 1D pipeline, which performs spectral classification and redshift measurement.
The LAMOST DR10 comprises a total of 11 441 011 spectra from 5923 observed plates. Of these, 11 100 139 are classified as stellar spectra, from which our initial sample groups are drawn. It employs a universal target selection strategy, providing more uniform coverage across stellar populations, and it has proven to be effective at identifying numerous new WD–main sequence binaries (Ren et al. 2013, 2014, 2018). Given its wide-area sky coverage and unique survey design, we believe it has great potential as a complementary (though currently underutilized) resource for identifying MWDs.
3 Identification of MWDs in LAMOST DR10
We constructed our sample by crossmatching LAMOST DR10 with the catalog of WD candidates from Gaia early data release three (EDR3) (Gentile Fusillo et al. 2021). We located 10 279 LAMOST spectra within 3 arcsec of Gaia WDs (and WD candidates).
We also crossmatched LAMOST DR10 with the latest SDSS-based catalogs of DAH (hydrogen-atmosphere) and DBH (helium-atmosphere) MWDs compiled by Amorim et al. (2023) and Hardy et al. (2023), respectively. This crossmatching provided a reference set of confirmed MWDs and helped us find more targets with similar features. It also allowed us to assess the effectiveness of the LAMOST spectra in recovering them.
Zeeman splitting was the primary diagnostic used to identify the magnetic fields in the WDs. It is a direct and robust indicator, as most WDs exhibit strong and clean hydrogen (or helium) absorption lines in the optical regime. The splitting of these lines provides direct evidence of the presence of a magnetic field, and when the features are clearly resolved, they enable an estimate of the field strength.
For MWDs exhibiting Zeeman-split spectral lines, the mean surface magnetic field can be estimated from the separation of split components. In the weak-field regime (B ≲ 2 MG), lower-level (n ≤ 3) Balmer lines are split into three components, with a separation given by
![Mathematical equation: $\[\Delta \lambda= \pm 4.67 \times 10^{-7} \lambda^2 B \qquad(\AA),\]$](/articles/aa/full_html/2026/04/aa57083-25/aa57083-25-eq1.png) (1)
(1)
where λ is in Å and B is in megagauss1.
However, for higher strength fields, the linear Zeeman approximation becomes inadequate, as the magnetic and Coulomb forces reach comparable magnitudes. For this reason, we decided to utilize the high-precision numerical framework provided by Schimeczek & Wunner (2014), which solves the nonrelativistic Schr odinger equation for the hydrogen atom across the full range of field strengths (0–4.7 × 10³ MG) relevant to MWDs. Their approach employs an expansion in two-dimensional B-splines to determine energy levels and dipole strengths for states up to n = 15. This method captures the complex l-mixing and the behavior of the energy levels near anticrossings, where transitions can shift rapidly. The resulting relationship between magnetic field strength and transition wavelengths for the Hα, Hβ, and Hγ series is illustrated in Fig. 12.
In our analysis, we compared the LAMOST DR10 spectra against these theoretical stationary transitions for the Balmer series. By shifting the observed spectra to the rest frame and comparing the morphology of Hα, Hβ, and Hγ to the Schimeczek transitions, we were able to provide robust identifications and estimate the mean surface magnetic field B. This method allows for the detection of fields even when the individual Zeeman components are not fully resolved, as the overall profile shape remains distinct. We confirmed the magnetic nature of stars previously identified in the SDSS-based catalogs of Amorim et al. (2023) and successfully identified new MWD candidates. A series of examples in diverse field strengths are shown in Fig. 2.
The resulting catalog includes the LAMOST designation, Gaia DR3 source ID, and the best-fit mean surface magnetic field B. Our results show a broad distribution of field strengths ranging from the detection limit of ~0.5 MG up to approximately 15 MG, demonstrating the capability of LAMOST’s medium-to-low resolution spectroscopy in characterizing the magnetic properties of the local WD population.
The relation between the observed mean field strength and the polar field strength, assuming a dipolar surface field, is
![Mathematical equation: $\[B=\frac{1}{2} B_p \sqrt{1+3 \cos ^2 ~\theta},\]$](/articles/aa/full_html/2026/04/aa57083-25/aa57083-25-eq2.png) (2)
(2)
where Bp is the polar field and θ is the angle between the field and the line of sight. Due to a limitation in spectral resolution and the diverse qualities of our spectra, we only estimated the mean field strength and did not take into account the line shapes. Our estimation also ignores binarity and any effect beyond dipole moments. The approach we used to calculate the field strengths is different from that of Amorim et al. (2023), and this difference can explain the occasional inconsistency between our measurements and theirs, as Amorim et al. (2023) reported the Bp values.
With the aid of reference targets and field estimations from Zeeman splitting, we visually inspected LAMOST WD spectra and identified 63 isolated MWDs, including 32 newly discovered objects. We also estimated the surface magnetic fields of these new objects.
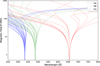 |
Fig. 1 Theoretical Zeeman splitting distribution as a function of magnetic field strength for the hydrogen Balmer lines Hα, Hβ, and Hγ transitions calculated based on the numerical models of Schimeczek & Wunner (2014). |
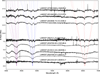 |
Fig. 2 Several LAMOST isolated MWD spectra with the Zeeman effect on their Hα, Hβ, and Hγ lines in the linear regimes. The spectra have been normalized to make better comparisons. As can be seen, the strength of the derived magnetic fields is positively correlated with the separation among the subcomponents of Balmer lines caused by Zeeman splitting. |
4 Results
A total of 129 common targets were found by crossmatching the LAMOST DR10 low-resolution spectroscopic database with the SDSS MWD catalogs (Kepler et al. 2013; Amorim et al. 2023; Hardy et al. 2023), using a matching radius of 2 arcsec. Visual inspection of these matched spectra revealed 31 objects exhibiting significant Zeeman splitting features. Using these SDSS-confirmed MWDs as reference examples, we extended our search to a broader sample of 10 279 WD candidates obtained by crossmatching LAMOST DR10 with the Gaia EDR3 WD catalog (Gentile Fusillo et al. 2021). This effort resulted in the identification of 63 LAMOST spectra displaying clear magnetic features – representing newly discovered MWDs in the LAMOST dataset (some of which include multiple exposures of the same object).
A full list of the isolated MWDs identified in LAMOST DR10, including previously known and newly discovered systems, is presented in Appendix A. Their spectra are presented in Appendix B, which is available on Zenodo.
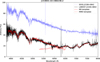 |
Fig. 3 Composite spectral analysis of J1538+0842. The LAMOST spectrum (black) is compared with an MWD template with a surface field of B ≈ 12 MG (dotted red line) and an M0 star template (dashed red line). While the MWD template fits the Zeeman-split Balmer lines in the blue channel (λ < 6500 Å), the M0 template is required to reproduce the molecular bands in the red channel (λ > 5500 Å). In contrast, the SDSS spectrum of the same target (blue), scaled for comparison, shows no significant M star features in the red channel. |
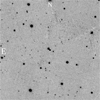 |
Fig. 4 Image of the 6′ × 6′ field of view of J1538+0842. The star in the cursor is our target MWD. An M type main sequence star sits roughly 7 arcsec away from it. |
4.1 LAMOST J1538+0842
Among the identified MWDs, J1538+0842 (SDSS J153843.10+084238.2) presents an interesting case. The LAMOST spectrum (Fig. 3) exhibits the clear Zeeman-split Balmer lines of an MWD with a surface field of ~12 MG, but it is superposed with prominent TiO bands and molecular features characteristic of an M-type main-sequence star at the red end (λ > 5500 Å). However, the latter features are not seen in the SDSS spectrum of this object.
Analysis of the sky atlas (Fig. 4) revealed an M-star companion located ~6.14″ from the MWD and 2.6 magnitudes brighter than our target in the SDSS r′ band. Given the LAMOST fiber radius of ~3.3″ and that the spectrum was taken under nonoptimal weather conditions, we believe that the main-sequence features in the spectrum are not intrinsic to the MWD’s immediate environment but are the result of flux contamination from this neighbor.
However, we point out that Gaia DR3 astrometry strongly suggests that this proximity is not a chance alignment. The two stars have nearly identical parallaxes (11.81 ± 0.12 mas and 11.80 ± 0.02 mas) and consistent proper motions: For the MWD, μα cos δ = 15.52 ± 0.12 mas yr−1, μδ = −65.16 ± 0.11 mas yr−1, and for the M dwarf, μα cos δ = 14.73 ± 0.02 mas yr−1, μδ = −65.86 ± 0.02 mas yr−1. When adopting a common parallax of 11.80 mas, the angular separation of 6.14″ corresponds to a minimum projected physical separation of ~520 AU. While the current data cannot definitively confirm a bound orbit, the matching astrometric parameters suggest that J1538+0842 and its neighbor may constitute a wide, fully detached MWD–main-sequence binary system.
Such systems have long been predicted by the classical fossil field theory, which states that the magnetic fields in MWDs are inherited from their Ap or Bp progenitors (Angel et al. 1981). Under this theory, if MWDs primarily result from single-star evolution, their presence in detached binaries should be as significant as their occurrence as isolated stars or in close interacting binaries. However, detached MWD–main-sequence binary systems have been notably absent from observational records (Liebert et al. 2005). This “missing” population has driven the development of alternative scenarios that favor binary interactions as the primary mechanism for magnetic field generation (Tout et al. 2008; Wickramasinghe et al. 2014; Belloni & Schreiber 2020). Thus, J1538+0842 represents a strong potential candidate for the first fully detached MWD–main-sequence binary.
5 Discussion
5.1 Comparison between LAMOST and SDSS MWD catalogs
Initially, we expected LAMOST to recover relatively cooler MWDs, under the assumption that SDSS preferentially selects hotter and bluer objects since it was primarily designed to target quasars and galaxies, a population that overlaps with hot WDs in color space (Richards et al. 2002; Smolčić et al. 2004). However, LAMOST and SDSS MWDs are similarly distributed in the WD branch seen in the Hertzsprung–Russell diagram in Fig. 5. The SDSS MWD catalogs, which comprise more than 800 objects, reveal an average effective temperature of 13 770 ± 5884 K and an average surface gravity of log g = 8.17 ± 0.53 (Amorim et al. 2023; Hardy et al. 2023). In comparison, our LAMOST MWD catalog contains 63 targets, with an average effective temperature of 14548 ± 5697 K and an average surface gravity of log g = 8.38 ± 0.36. Differences in effective temperature and surface gravity are statistically insignificant within the quoted dispersions. This outcome suggests that the limited depth and spectral quality of LAMOST observations may have hindered the detection of cooler MWDs. Consequently, the selection effects of SDSS with respect to MWD temperature appear to be less significant than originally anticipated.
5.2 The origin of magnetic fields in MWDs
The origin of strong MWDs remains controversial, as classical theories often conflict with observational results. Historically, MWD magnetic fields were assumed to be fossil remnants from magnetic Ap and Bp stars, preserved through stellar evolution via magnetic flux conservation (Angel et al. 1981). However, the rapid increase in confirmed MWDs (Gänsicke et al. 2002; Schmidt et al. 2003; Vanlandingham et al. 2005) has highlighted inconsistencies between theoretical predictions and observations.
For example, population synthesis studies of SDSS MWDs by Liebert et al. (2005) challenged the fossil field model by noting the near absence of fully detached MWD–main-sequence binaries. If MWD progenitors evolved independently, such detached binaries should be relatively common. Furthermore, Kawka et al. (2007) showed that the birth rates of Ap and Bp stars are insufficient to account for the observed fraction of MWDs among evolved stars. These discrepancies indicate that classical single-star scenarios alone cannot fully explain MWD magnetism.
Several alternative formation scenarios have been proposed. One scenario, the coalescing double WD scenario, predicts magnetic field generation in the corona of the merger remnant (Garcia-Berro et al. 2012), while another, the crystallization scenario, suggests that cooling and solidification of the WD interior can amplify preexisting fields (Isern et al. 2017). Both scenarios have explanatory power for some MWDs, but neither can account for the full range of observed field strengths.
A more widely favored hypothesis links high magnetic fields to binary interactions. Tout et al. (2008) proposed that MWD magnetism originates during the common-envelope phase, with closer binary interactions producing stronger fields. This idea has been further supported by Wickramasinghe et al. (2014), who developed a dynamo model in which differential rotation during binary interactions amplifies toroidal fields inside the WD.
Schreiber et al. (2021) recently proposed a unified dynamo framework in which both internal and binary-driven processes contribute to the formation of MWDs. In this model, convective motions induced by core crystallization in cooling WDs can sustain a dynamo that generates moderate magnetic fields; with the influence from a donor star, accretion-driven spin-up and tidal effects amplify differential rotation and trigger much stronger dynamos. These two channels are not mutually exclusive but act together to explain the wide variety of magnetic field strengths and current MWD configurations.
While the dual-channel dynamo framework provides an attractive explanation for the overall diversity of MWDs, our discovery of a fully detached MWD–main-sequence binary does not fit naturally into this picture. The presence of a strong-field MWD in a detached binary system, however, raises questions. Unless its magnetism is the relic of a fossil field from an Ap or Bp progenitor, the most plausible alternative is that this system originated in a hierarchical triple, with the present-day MWD formed through the merger of an inner companion. The relatively high mass of the WD (0.875 M⊙; Kilic et al. 2025), its log g = 8.44, and effective temperature of ~9000 K further strengthen the case for a merger origin.
Our discovery of a fully detached MWD–main-sequence system, LAMOST J1538+0842, provides a critical observational counterpoint. The presence of a strong magnetic field in a detached configuration demonstrates that intense magnetism can exist without ongoing mass transfer or immediate post-common-envelope interaction. This finding supports the idea that internal dynamo mechanisms, potentially combined with earlier binary interactions or crystallization processes, may contribute to magnetic field generation. Furthermore, it suggests that detached magnetic systems, though rare, represent an important evolutionary stage that should be incorporated into models of MWD formation and evolution.
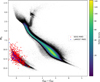 |
Fig. 5 Hertzsprung–Russell diagram showing the locations of MWDs. Red stars mark SDSS MWDs, and blue stars mark LAMOST MWDs. Both groups are distributed uniformly along the WD cooling sequence. |
6 Conclusions
In this work, we have presented the first systematic search for isolated MWDs in the LAMOST DR10 spectroscopic database. We identified a total of 78 LAMOST spectra from 63 isolated MWDs, including 38 spectra of 32 newly discovered objects. Our analysis indicates that LAMOST is capable of detecting MWDs across a range of temperatures and surface gravities that are complementary to SDSS and that LAMOST has the potential to mitigate selection biases inherent to previous surveys. Comparisons between the LAMOST and SDSS MWD populations show no statistically significant differences. This indicates that the current selection effect on MWDs is negligible. Nevertheless, given its wide-area sky coverage and balanced sampling of stellar populations, LAMOST represents a promising resource for further expanding the known population of MWDs. Overall, our results highlight LAMOST’s capability to contribute to the study of isolated MWDs by providing new targets for follow-up spectroscopic and photometric investigations, which will ultimately help improve our understanding of the formation and evolution of magnetic fields in WDs.
Data availability
Appendix B, containing spectra of all MWDs, is available on Zenodo (https://zenodo.org/records/18940948). The preliminary list of 10 279 LAMOST spectra made by crossmatching LAMOST DR10 with Gaia EDR3 WD catalog (Gentile Fusillo et al. 2021) is available at the CDS via https://cdsarc.cds.unistra.fr/viz-bin/cat/J/A+A/708/A275.
Acknowledgements
We would like to thank the anonymous referee for useful comments and suggestions. We thank Dr. Schimeczek for kindly sharing his detailed calculation of atomic data for the spectral analysis of DA MWDs, which is crucial to our work. Sicheng Yu is funded by the Vilho, Yrjä and Kalle Väisälä Foundation of the Finnish Academy of Science and Letters. Haotong Zhang thanks the support of the National Natural Science Foundation of China (12273056) and the National Key R&D Program of China (Grant No. 2022YFA1603002). Juanjuan Ren thanks the support of the China Manned Space Program (Grant No. CMS-CSST-2025-A19). Hailong Yuan and Zongrui Bai are supported by the National Key R&D Program of China (Grant No. 2023YFA1607901). Ming Zhou is supported by the National Natural Science for Youth Foundation of China (Grant No. 12503091) This work is supported by and based on the survey of Guoshoujing Telescope. Guoshoujing Telescope (the Large Sky Area Multi-Object Fiber Spectroscopic Telescope, LAMOST) is a National Major Scientific Project built by the Chinese Academy of Sciences.
References
- Amorim, L. L., Kepler, S. O., Külebi, B., Jordan, S., & Romero, A. D. 2023, ApJ, 944, 56 [NASA ADS] [CrossRef] [Google Scholar]
- Angel, J. R. P., Borra, E. F., & Landstreet, J. D. 1981, ApJS, 45, 457 [NASA ADS] [CrossRef] [Google Scholar]
- Angel, J. R. P., Liebert, J., & Stockman, H. S. 1985, ApJ, 292, 260 [NASA ADS] [CrossRef] [Google Scholar]
- Bai, Z., Zhang, H., Yuan, H., et al. 2017a, PASP, 129, 024004 [NASA ADS] [CrossRef] [Google Scholar]
- Bai, Z.-R., Zhang, H.-T., Yuan, H.-L., et al. 2017b, Res. Astron. Astrophys., 17, 091 [CrossRef] [Google Scholar]
- Belloni, D., & Schreiber, M. R. 2020, MNRAS, 492, 1523 [NASA ADS] [CrossRef] [Google Scholar]
- Cui, X.-Q., Zhao, Y.-H., Chu, Y.-Q., et al. 2012, Res. Astron. Astrophys., 12, 1197 [Google Scholar]
- Ferrario, L., de Martino, D., & Gänsicke, B. T. 2015, Space Sci. Rev., 191, 111 [Google Scholar]
- García-Berro, E., Lorán-Aguilar, P., Aznar-Siguán, G., et al. 2012, ApJ, 749, 25 [CrossRef] [Google Scholar]
- Gentile Fusillo, N. P., Tremblay, P. E., Cukanovaite, E., et al. 2021, MNRAS, 508, 3877 [NASA ADS] [CrossRef] [Google Scholar]
- Gänsicke, B. T., Euchner, F., & Jordan, S. 2002, A&A, 394, 957 [NASA ADS] [CrossRef] [EDP Sciences] [Google Scholar]
- Hardy, F., Dufour, P., & Jordan, S. 2023, MNRAS, 520, 6135 [CrossRef] [Google Scholar]
- Isern, J., García-Berro, E., Külebi, B., & Lorén-Aguilar, P. 2017, ApJ, 836, L28 [NASA ADS] [CrossRef] [Google Scholar]
- Kawka, A., Vennes, S., Schmidt, G. D., Wickramasinghe, D. T., & Koch, R. 2007, ApJ, 654, 499 [NASA ADS] [CrossRef] [Google Scholar]
- Kepler, S. O., Pelisoli, I., Jordan, S., et al. 2013, MNRAS, 429, 2934 [Google Scholar]
- Kilic, M., Bergeron, P., Blouin, S., et al. 2025, ApJ, 979, 157 [Google Scholar]
- Külebi, B., Jordan, S., Euchner, F., Gänsicke, B. T., & Hirsch, H. 2009, A&A, 506, 1341 [NASA ADS] [CrossRef] [EDP Sciences] [Google Scholar]
- Liebert, J., Wickramsinghe, D. T., Schmidt, G. D., et al. 2005, AJ, 129, 2376 [NASA ADS] [CrossRef] [Google Scholar]
- Ren, J., Luo, A., Li, Y., et al. 2013, AJ, 146, 82 [CrossRef] [Google Scholar]
- Ren, J. J., Rebassa-Mansergas, A., Luo, A. L., et al. 2014, A&A, 570, A107 [NASA ADS] [CrossRef] [EDP Sciences] [Google Scholar]
- Ren, J. J., Rebassa-Mansergas, A., Parsons, S. G., et al. 2018, MNRAS, 477, 4641 [NASA ADS] [CrossRef] [Google Scholar]
- Richards, G. T., Fan, X., Newberg, H. J., et al. 2002, AJ, 123, 2945 [NASA ADS] [CrossRef] [Google Scholar]
- Schimeczek, C., & Wunner, G. 2014, ApJS, 212, 26 [CrossRef] [Google Scholar]
- Schmidt, G. D., Harris, H. C., Liebert, J., et al. 2003, ApJ, 595, 1101 [NASA ADS] [CrossRef] [Google Scholar]
- Schreiber, M. R., Belloni, D., Gänsicke, B. T., Parsons, S. G., & Zorotovic, M. 2021, Nat. Astron., 5, 648 [NASA ADS] [CrossRef] [Google Scholar]
- Shaw, A. W., Heinke, C. O., Mukai, K., et al. 2020, MNRAS, 498, 3457 [NASA ADS] [CrossRef] [Google Scholar]
- Smolčić, V., Ivezić, Ž., Knapp, G. R., et al. 2004, ApJ, 615, L141 [Google Scholar]
- Su, D.-Q., & Cui, X.-Q. 2004, Chinese J. Astron. Astrophys., 4, 1 [Google Scholar]
- Tout, C. A., Wickramasinghe, D. T., Liebert, J., Ferrario, L., & Pringle, J. E. 2008, MNRAS, 387, 897 [NASA ADS] [CrossRef] [Google Scholar]
- Vanlandingham, K. M., Schmidt, G. D., Eisenstein, D. J., et al. 2005, AJ, 130, 734 [NASA ADS] [CrossRef] [Google Scholar]
- Wang, S.-G., Su, D.-Q., Chu, Y.-Q., Cui, X., & Wang, Y.-N. 1996, Appl. Opt., 35, 5155 [NASA ADS] [CrossRef] [Google Scholar]
- Wickramasinghe, D. T., Tout, C. A., & Ferrario, L. 2014, MNRAS, 437, 675 [NASA ADS] [CrossRef] [Google Scholar]
- York, D. G., Adelman, J., John E. Anderson, J., et al. 2000, AJ, 120, 1579 [NASA ADS] [CrossRef] [Google Scholar]
For completeness, the full quadratic Zeeman effect for higher fields is given by
![Mathematical equation: $\[\Delta \lambda_q \approx-4.97 \times 10^{-23} \lambda^2 n^4(1+m_l^2) B^2~(\AA),\]$](/articles/aa/full_html/2026/04/aa57083-25/aa57083-25-eq3.png)
where n is the principal quantum number and ml the magnetic quantum number.
The atomic transition data calculated by Schimeczek & Wunner (2014) are no longer available through the website provided in their original article, but the data can be found at https://doi.org/10.18419/DARUS-2118
Appendix A Full catalog of isolated MWDs
The following table lists all MWDs identified in this work. The columns in the table are structured as follows:
Designation: Target designation from celestial coordinates (RA and Dec, in degrees). For example, J015013.17+283556.2 corresponds to RA = 01h50m13.17s, Dec = +28°35′56.2″.
Gaia ID: Target ID number from Gaia EDR3 catalog.
WD type: Indicates whether the target MWD is hydrogen-rich (DA), helium-rich (DB) or carbon-rich (DQ).
BLAMOST: Mean magnetic field estimated with LAMOST spectra in MG.
BSDSS: Magnetic field strength from SDSS MWD catalogs (Amorim et al. 2023; Hardy et al. 2023).
Plx: Parallax (mas) from Gaia EDR3.
BP–RP: BP–RP colors from Gaia EDR3.
G: G magnitudes from Gaia EDR3.
Teff: Effective temperature from fitting dereddened G, BP, and RP absolute fluxes with pure-H model atmospheres, from the Gaia EDR3 WD catalog (Gentile Fusillo et al. 2021), with the caveat that the models do not include magnetic field.
log g: Surface gravity from fitting dereddened G, BP, and RP absolute fluxes with pure-H model atmospheres, from the Gaia EDR3 WD catalog (Gentile Fusillo et al. 2021), with the caveat that the models do not include magnetic field.
LAMOST isolate MWDs with observational details and basic parameters.
All Tables
All Figures
|
Fig. 1 Theoretical Zeeman splitting distribution as a function of magnetic field strength for the hydrogen Balmer lines Hα, Hβ, and Hγ transitions calculated based on the numerical models of Schimeczek & Wunner (2014). |
| In the text | |
|
Fig. 2 Several LAMOST isolated MWD spectra with the Zeeman effect on their Hα, Hβ, and Hγ lines in the linear regimes. The spectra have been normalized to make better comparisons. As can be seen, the strength of the derived magnetic fields is positively correlated with the separation among the subcomponents of Balmer lines caused by Zeeman splitting. |
| In the text | |
|
Fig. 3 Composite spectral analysis of J1538+0842. The LAMOST spectrum (black) is compared with an MWD template with a surface field of B ≈ 12 MG (dotted red line) and an M0 star template (dashed red line). While the MWD template fits the Zeeman-split Balmer lines in the blue channel (λ < 6500 Å), the M0 template is required to reproduce the molecular bands in the red channel (λ > 5500 Å). In contrast, the SDSS spectrum of the same target (blue), scaled for comparison, shows no significant M star features in the red channel. |
| In the text | |
|
Fig. 4 Image of the 6′ × 6′ field of view of J1538+0842. The star in the cursor is our target MWD. An M type main sequence star sits roughly 7 arcsec away from it. |
| In the text | |
|
Fig. 5 Hertzsprung–Russell diagram showing the locations of MWDs. Red stars mark SDSS MWDs, and blue stars mark LAMOST MWDs. Both groups are distributed uniformly along the WD cooling sequence. |
| In the text | |
Current usage metrics show cumulative count of Article Views (full-text article views including HTML views, PDF and ePub downloads, according to the available data) and Abstracts Views on Vision4Press platform.
Data correspond to usage on the plateform after 2015. The current usage metrics is available 48-96 hours after online publication and is updated daily on week days.
Initial download of the metrics may take a while.