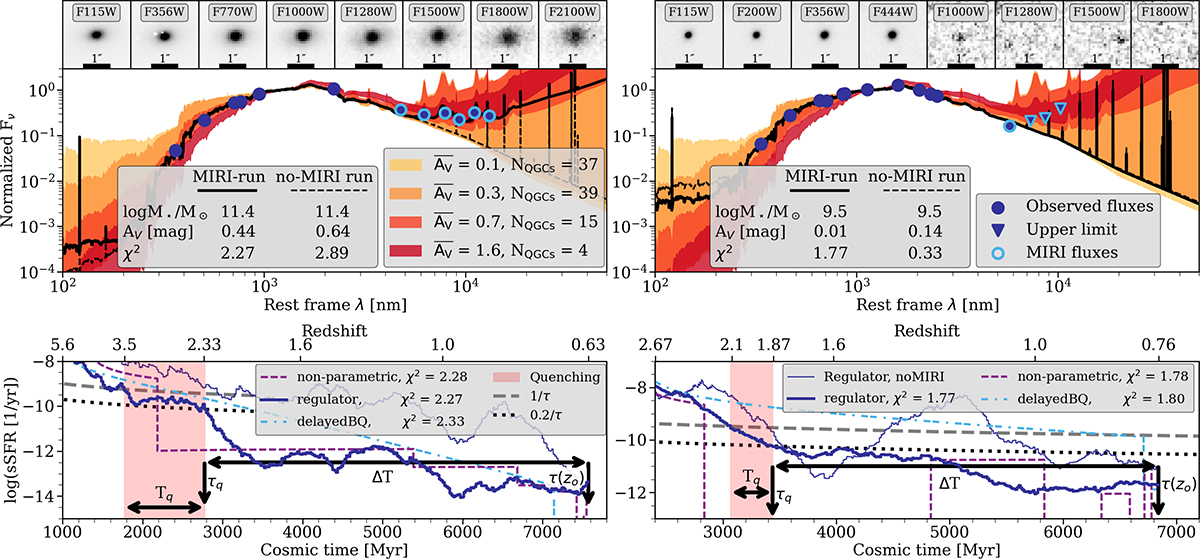
Fig. 1.
Download original image
Exemplary QGCs from our final sample: Massive system on the left and a less massive one on the right. Top: CIGALE SEDs. Solid and dashed black lines show the best–fit SEDs for the same galaxy using the regulator SFH with and without JWST/MIRI photometry for the MIRI and no–MIRI runs, respectively. Blue circles are detections; triangles are 3σ upper limits. JWST cutouts are displayed above each SED. Shaded envelopes indicate the range of K–band–normalised SEDs for QGCs binned by median AV; the legend lists the median AV values and number of objects in each bin. Bottom: sSFHs for the same QGC from the MIRI run. The solid dark blue, dashed violet, and dash-dotted light blue lines correspond to the regulator, non-parametric, and delayedBQ models, respectively. The thick and thin dark-blue lines show the difference between MIRI and no-MIRI runs. The dotted black line marks the quiescent threshold and the dashed black line the star-forming threshold (following Pacifici et al. 2016). Arrows mark the quantities used in this work for the regulator model: the quenching time, Tq, the quenching moment, τq, the cosmic time at the observation redshift, τ(zo), and the time since quenching, ΔT ≡ τ(zo)−τq.
Current usage metrics show cumulative count of Article Views (full-text article views including HTML views, PDF and ePub downloads, according to the available data) and Abstracts Views on Vision4Press platform.
Data correspond to usage on the plateform after 2015. The current usage metrics is available 48-96 hours after online publication and is updated daily on week days.
Initial download of the metrics may take a while.