Fig. D.1.
Download original image
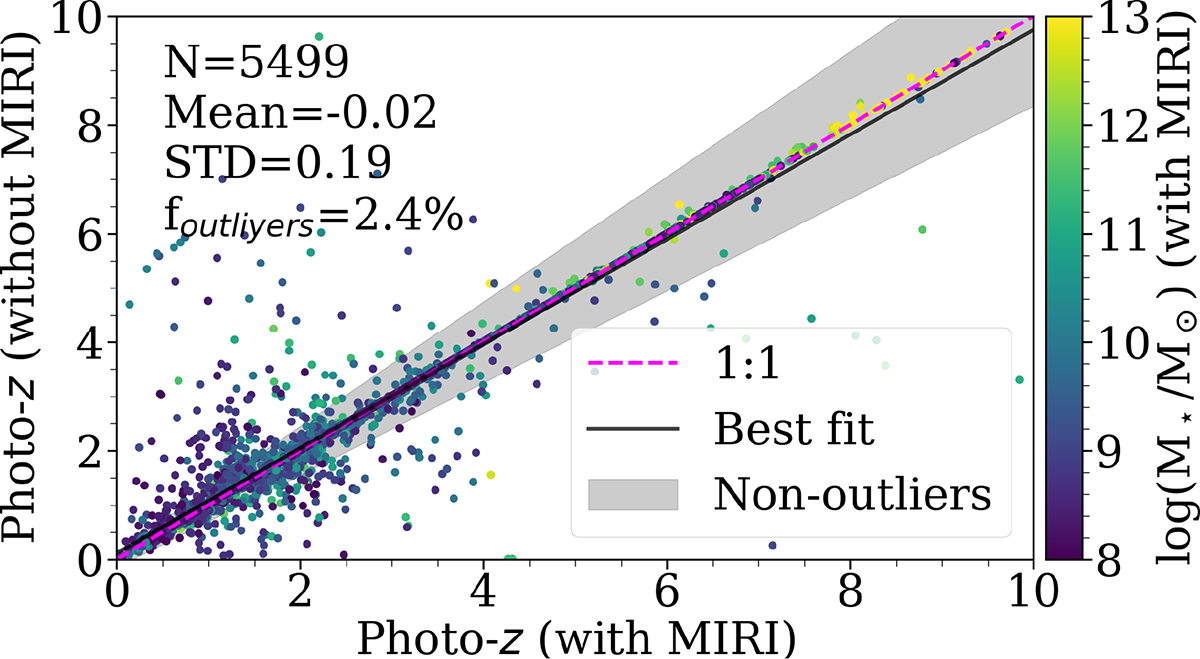
Photo−z estimation with and without MIRI data for galaxies with. The colour represent the stellar mass estimated in the run with MIRI data. The dashed magenta line shows 1:1 relation, while the solid black line represent the best fit. The grey shaded region show the non-outliers region defined as |zwithMIRI − zwithoutMIRI|/(1 + zwithMIRI) > 0.15.
Current usage metrics show cumulative count of Article Views (full-text article views including HTML views, PDF and ePub downloads, according to the available data) and Abstracts Views on Vision4Press platform.
Data correspond to usage on the plateform after 2015. The current usage metrics is available 48-96 hours after online publication and is updated daily on week days.
Initial download of the metrics may take a while.