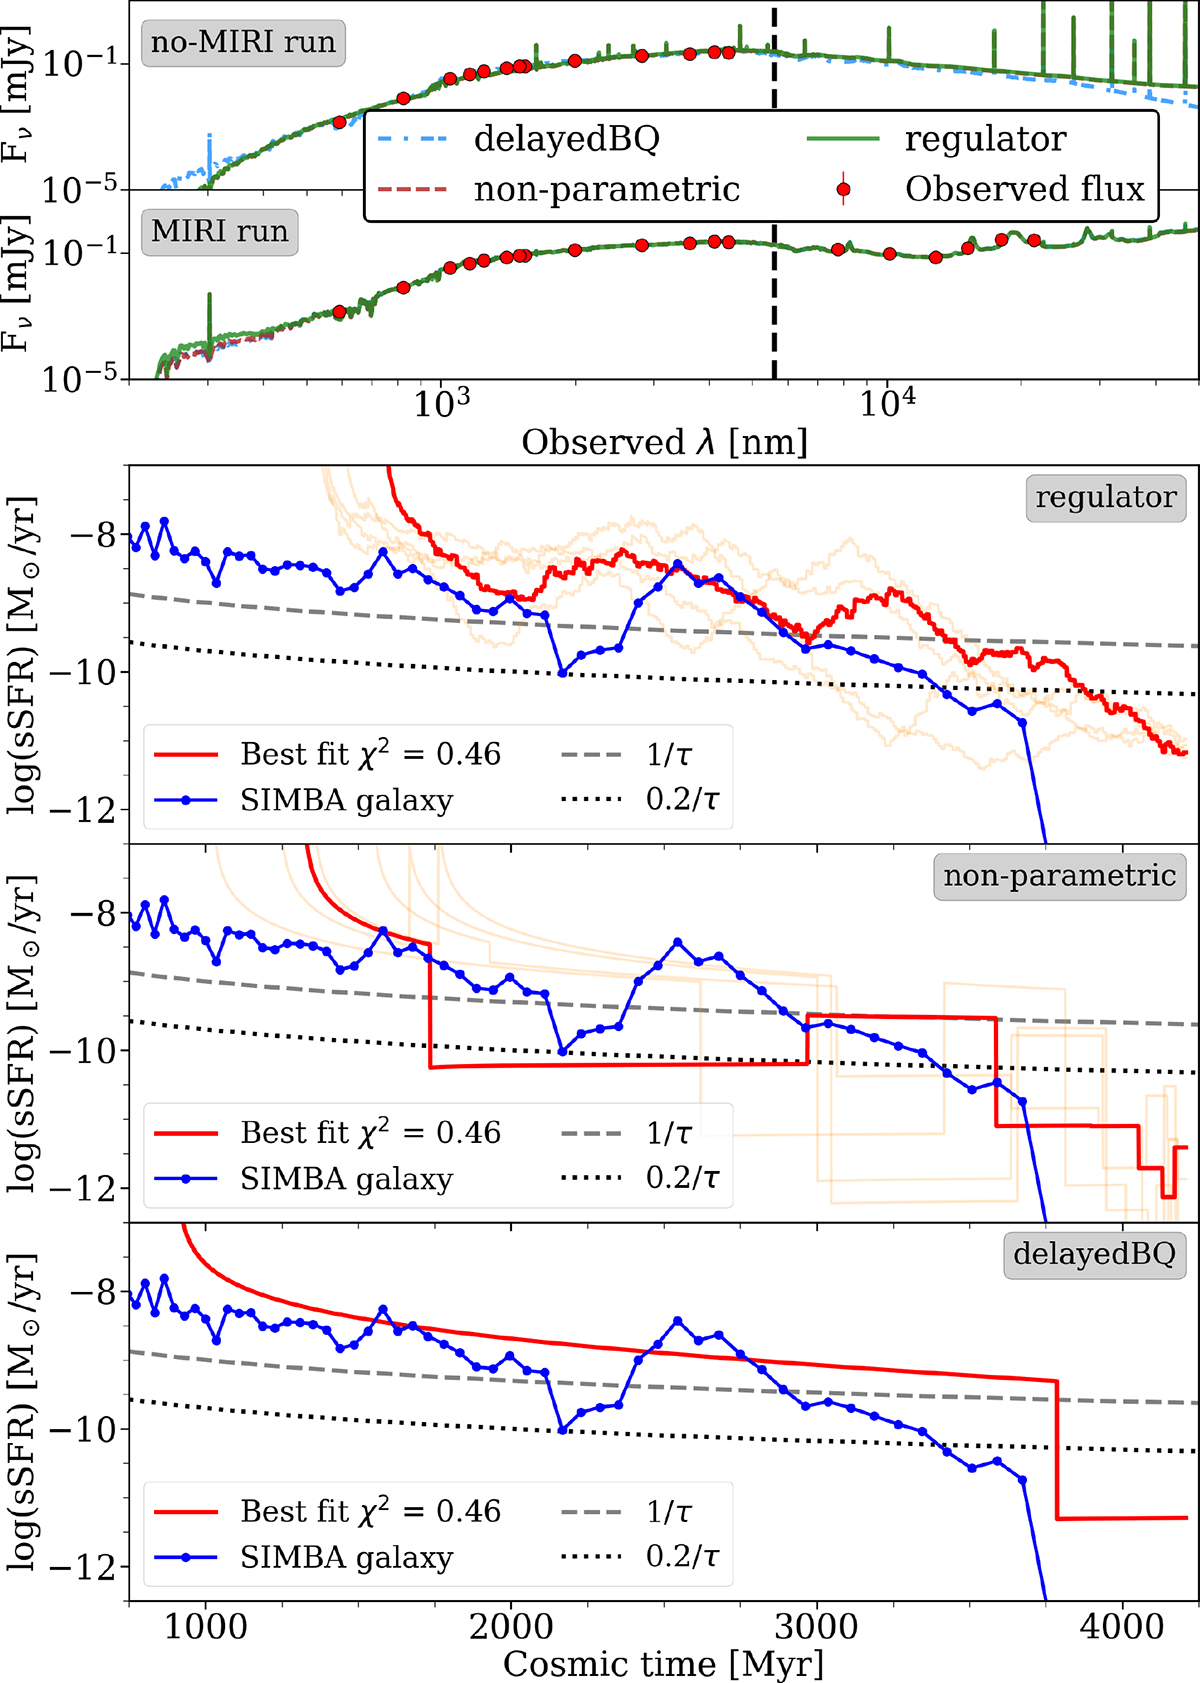
Fig. F.1.
Download original image
Best SEDs and corresponding sSFHs of the SIMBA galaxy. The top figure shows comparison of SEDs from the no-MIRI vs MIRI run. The observed fluxes, obtained by convolving filter with simulated SED, are marked with red circles. The colours and line styles of SEDs correspond to the used SFH. The dashed black line marks position of JWST/MIRI F560W filter. The bottom figure compares the sSFHs directly from SIMBA and from CIGALE from the MIRI run. From top to bottom: Regulator, non-parametric, and delayedBQ SFH. The blue line shows values of sSFH directly from SIMBA galaxy catalogue. The red line shows the best CIGALE fit. The orange lines in the background in regulator and non-parametric panels show the other four best fits (each probing 200 random models; see Sect. 3.2). The dashed and dotted lines show star-forming and quiescent threshold, respectively, proposed by Pacifici et al. (2016).
Current usage metrics show cumulative count of Article Views (full-text article views including HTML views, PDF and ePub downloads, according to the available data) and Abstracts Views on Vision4Press platform.
Data correspond to usage on the plateform after 2015. The current usage metrics is available 48-96 hours after online publication and is updated daily on week days.
Initial download of the metrics may take a while.