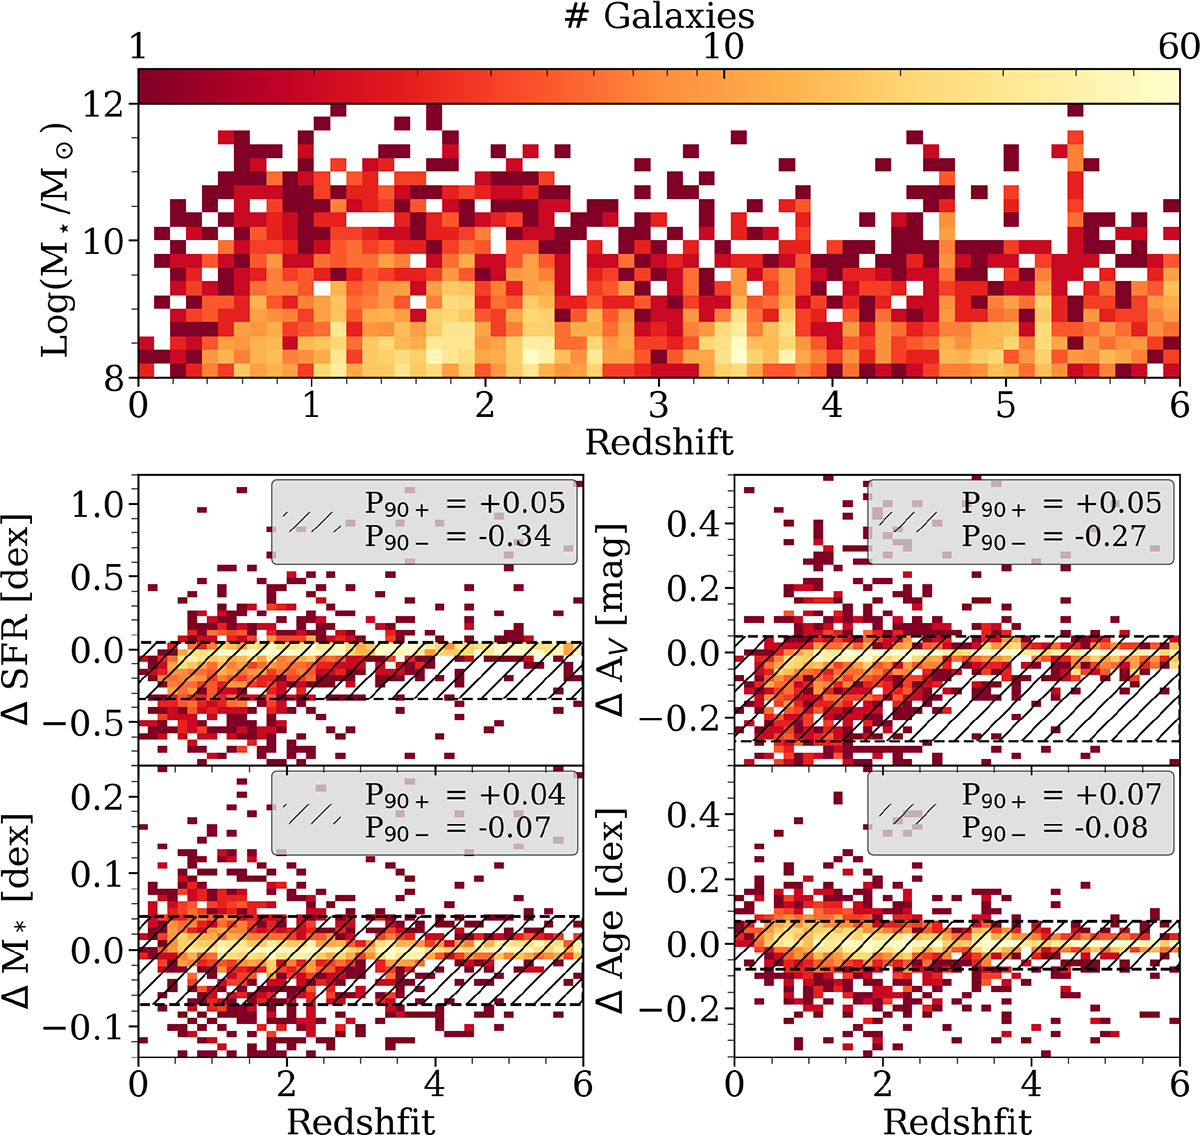
Fig. 2.
Download original image
Top: Distribution of the M★ in function of redshift of the final sample from the regulator MIRI run. Bottom: Distributions of differences in the main physical properties (SFR in M⊙/yr and the M★ in M⊙, AV in mag, age in Myr) between the MIRI and no-MIRI runs. The hatched region shows the 90th percentiles of the distributions (P90) in both directions.
Current usage metrics show cumulative count of Article Views (full-text article views including HTML views, PDF and ePub downloads, according to the available data) and Abstracts Views on Vision4Press platform.
Data correspond to usage on the plateform after 2015. The current usage metrics is available 48-96 hours after online publication and is updated daily on week days.
Initial download of the metrics may take a while.