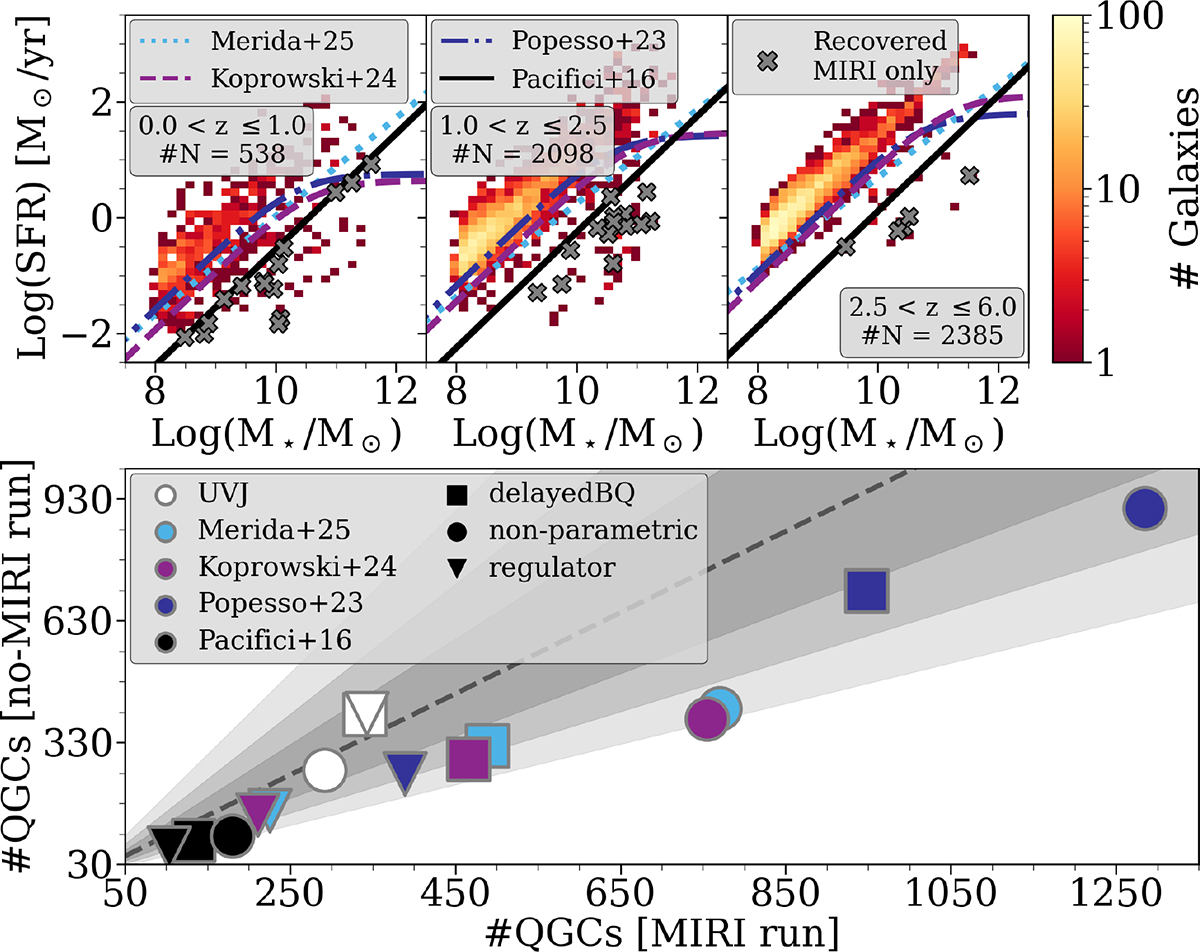
Fig. 4.
Download original image
Top: SFR-M★ plane for different redshifts with galaxies from the final sample from the MIRI run with the regulator SFH. The different lines present quiescence selection from the literature: the sSFR criterion in black; Popesso et al. (2023) in dark blue; Koprowski et al. (2024) in violet; and Mérida et al. (2026) in light blue. The grey crosses represent QGCs selected by the sSFR criterion in the regulator MIRI run, which were not recovered in the no-MIRI run. Bottom: Comparison of the QGCs sample size, depending on the selection criterion and SFH model for the MIRI and no-MIRI runs. The colours of the points represent the MSs and are the same as at top panel. The markers represent SFH model: Regulator (triangle); non-parametric (circles); and delayedBQ (squares). The dashed line shows one-to-one relation. With the shaded regions we mark 30%, 60%, and 100% relative distance from the one-to-one relation.
Current usage metrics show cumulative count of Article Views (full-text article views including HTML views, PDF and ePub downloads, according to the available data) and Abstracts Views on Vision4Press platform.
Data correspond to usage on the plateform after 2015. The current usage metrics is available 48-96 hours after online publication and is updated daily on week days.
Initial download of the metrics may take a while.