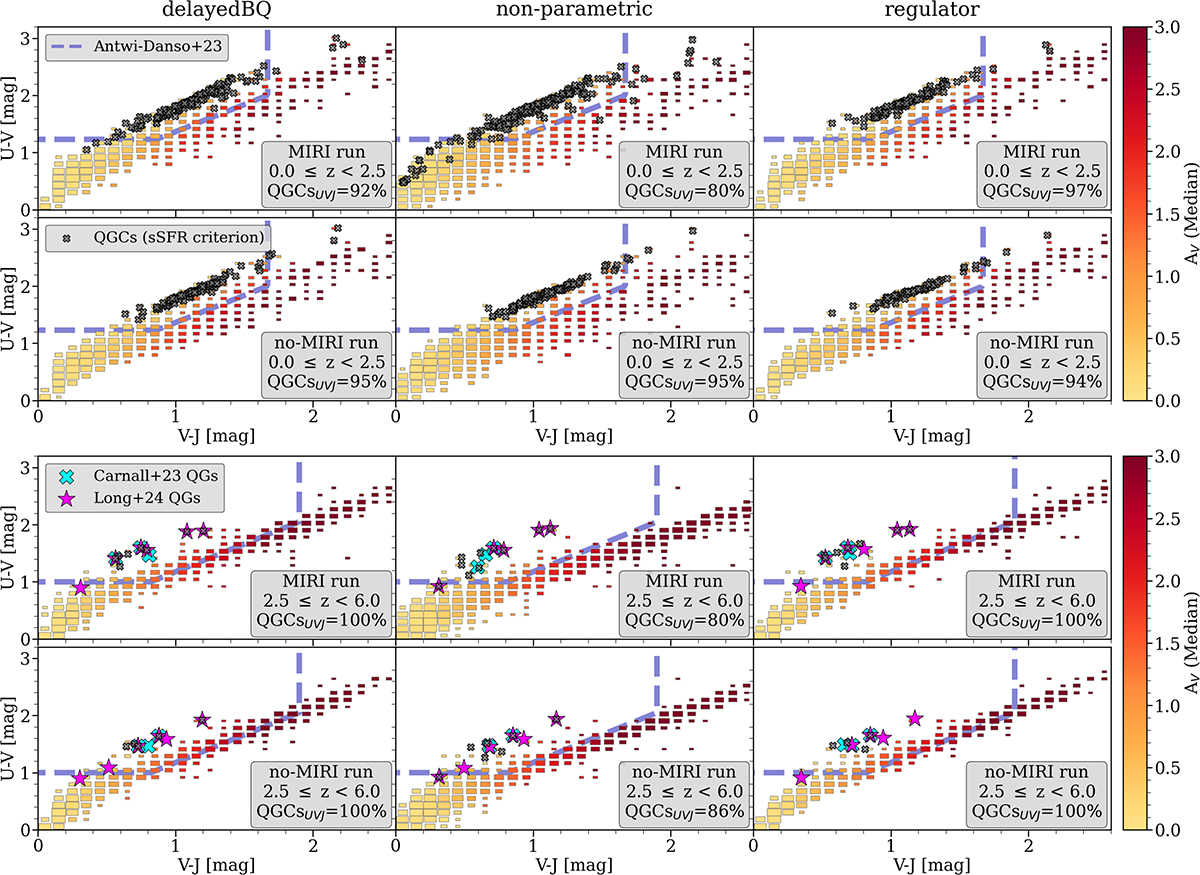
Fig. 5.
Download original image
Comparison of UVJ diagrams for galaxies with z < 2.5 (top six panels) and 2.5 ≤ z < 6 (bottom six panels) for mass-complete sample (M* ≥ 108 M⊙) from different runs. The squares are sized logarithmically according to the number of galaxies in the bin. We colour-coded the median attenuation in V-band (AV) as the histogram in the background. The grey crosses represent the QGCs selected with sSFR criterion. The dashed blue line shows the redshift-dependent criterion for quiescence by Antwi-Danso et al. (2023). We marked the fraction of QGCs (sSFR criterion) caught by UVJ criterion in the lower right corner of each panel. Top panels: Results from the MIRI run. Bottom panels: Results from the no-MIRI run. The columns are related to the SFH model used in the run, from left to right: DelayedBQ, non-parametric, and regulator. Additionally, we included galaxies we were able to recover as QGs using the Koprowski et al. (2024) MS offset criteria, with cyan crosses marking QGs from Carnall et al. (2023a) and magenta stars marking QGs from Long et al. (2024). For details, see Appendix G.
Current usage metrics show cumulative count of Article Views (full-text article views including HTML views, PDF and ePub downloads, according to the available data) and Abstracts Views on Vision4Press platform.
Data correspond to usage on the plateform after 2015. The current usage metrics is available 48-96 hours after online publication and is updated daily on week days.
Initial download of the metrics may take a while.