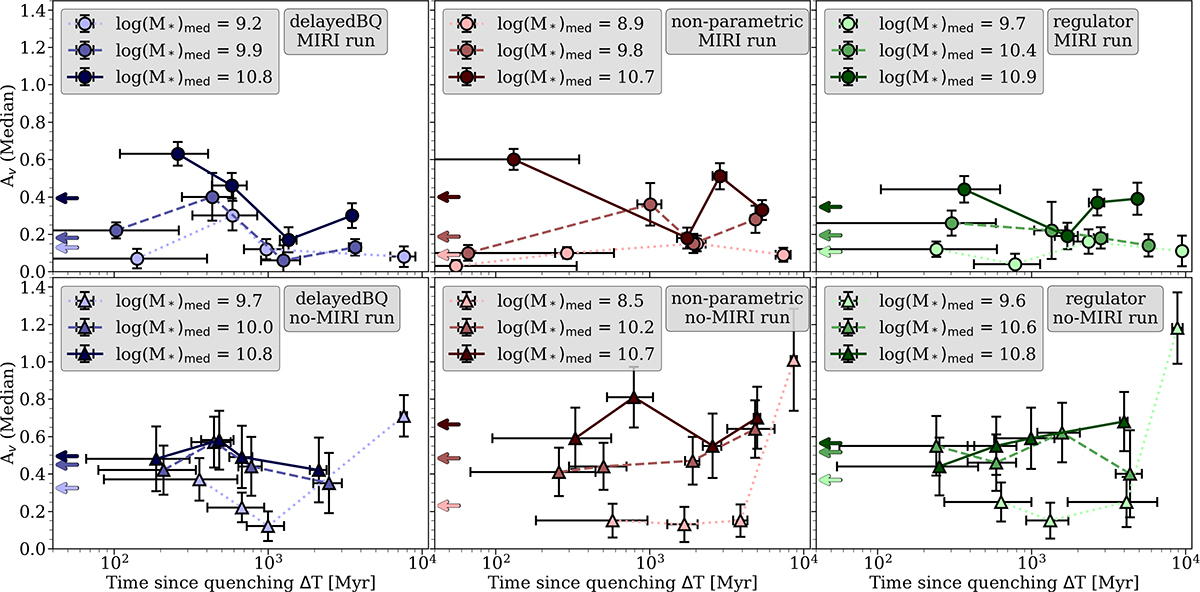
Fig. 6.
Download original image
Relation between time since quenching (ΔT) and the AV of the mass-complete QGCs at z ≤ 2.5. The columns show different SFH models used in the run, from left to right: DelayedBQ, non-parametric, and regulator, while the rows show the MIRI vs no-MIRI runs. The colours represent the median M★ of each bins. The arrows on the left of each panel show the weighted mean for the corresponding M★ bin.
Current usage metrics show cumulative count of Article Views (full-text article views including HTML views, PDF and ePub downloads, according to the available data) and Abstracts Views on Vision4Press platform.
Data correspond to usage on the plateform after 2015. The current usage metrics is available 48-96 hours after online publication and is updated daily on week days.
Initial download of the metrics may take a while.