Fig. A.1.
Download original image
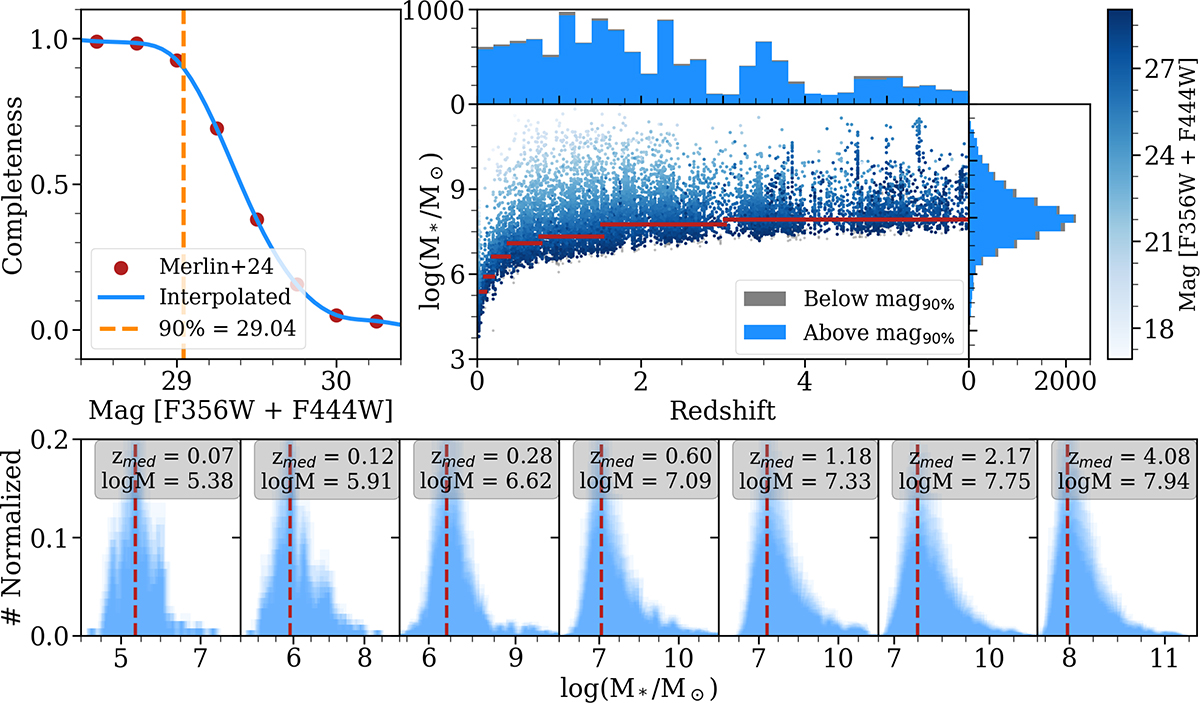
Completeness analysis using the first method with the regulator MIRI run results. Top left: Apparent magnitude completeness curve. The red points are values from (Merlin et al. 2024), the blue line is the interpolated curve, and the dashed orange line is the value for 90% completeness. Top right: M★-redshift plane with histograms. In grey we mark galaxies below the mag90% limit, while the white to blue colours represent the apparent magnitude of each galaxy. The red lines show the 90% completeness for each redshift bin. Bottom panels: Histograms for each of the redshift bins. The estimated maximum of the distribution is shown with dashed red lines. The median redshift of the galaxies in bin is given a the top of each panel with the maximum of the distribution.
Current usage metrics show cumulative count of Article Views (full-text article views including HTML views, PDF and ePub downloads, according to the available data) and Abstracts Views on Vision4Press platform.
Data correspond to usage on the plateform after 2015. The current usage metrics is available 48-96 hours after online publication and is updated daily on week days.
Initial download of the metrics may take a while.