Open Access
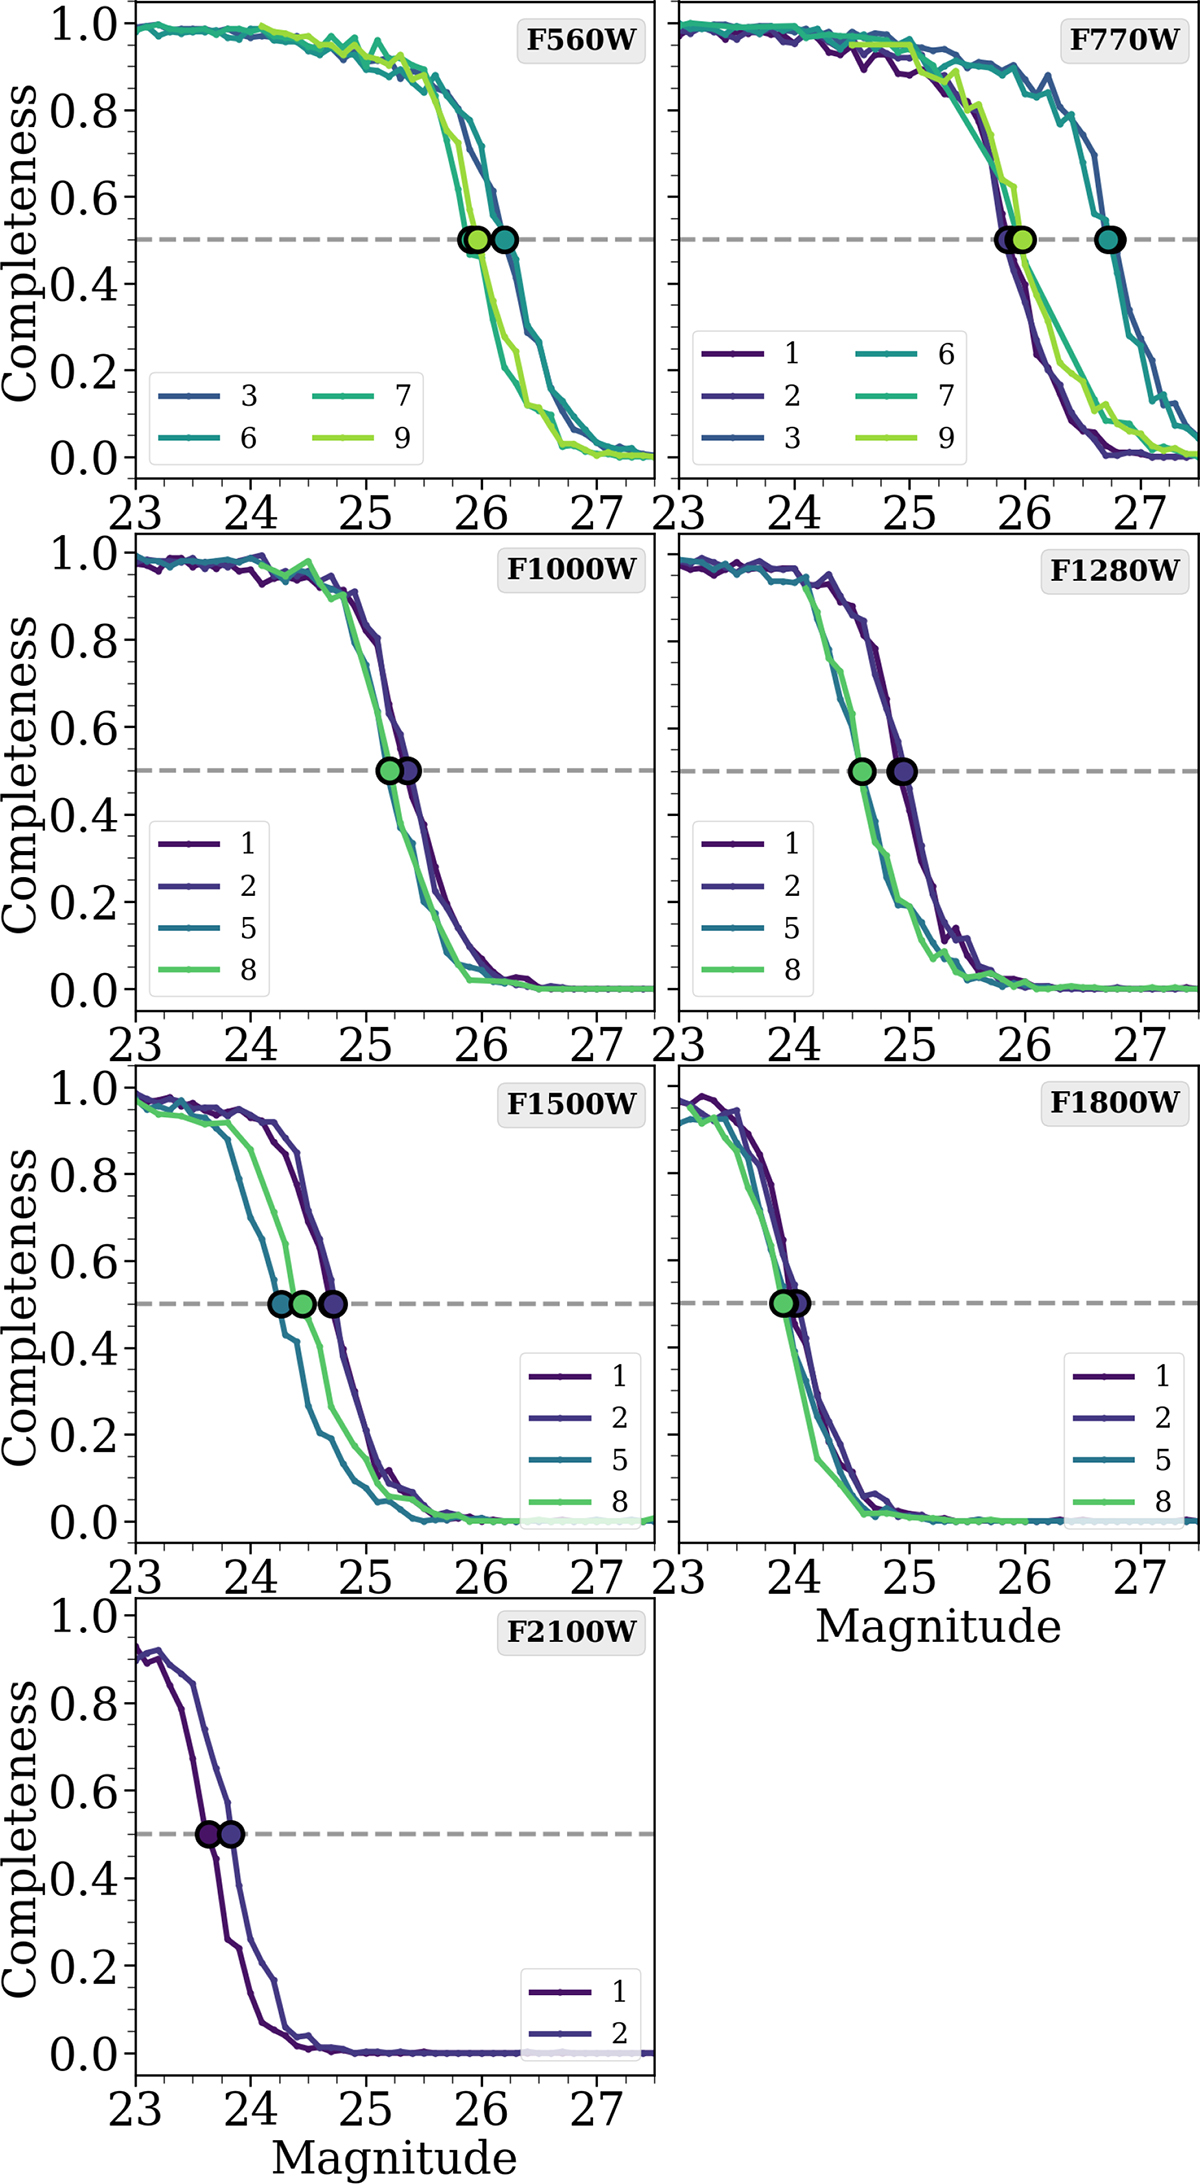
Fig. B.1.
Download original image
Completeness curves for MIRI observations from the CEERS program. Each panel represents different band, which is written in the upper-right corner. Each coloured line represents MIRI pointing. The dashed grey line marks completeness of 50%, and the circles show the estimated 5σ upper limit.
Current usage metrics show cumulative count of Article Views (full-text article views including HTML views, PDF and ePub downloads, according to the available data) and Abstracts Views on Vision4Press platform.
Data correspond to usage on the plateform after 2015. The current usage metrics is available 48-96 hours after online publication and is updated daily on week days.
Initial download of the metrics may take a while.