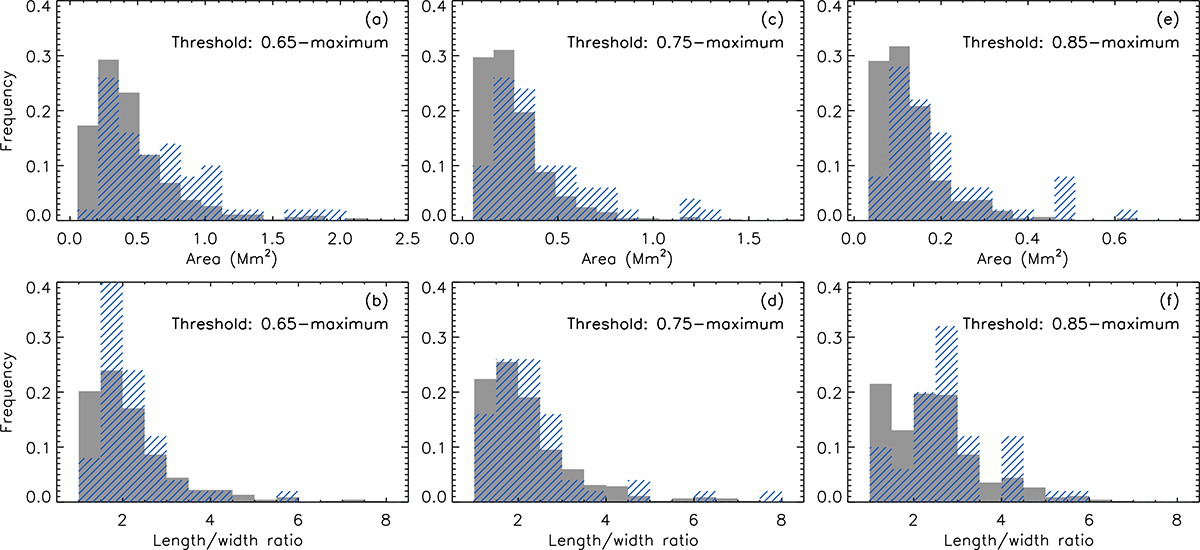
Fig. A.2.
Download original image
Normalized distributions of areas (upper panels) and length-to-width ratio (lower panels) of the base brightenings detected in both methods. The gray bars show results from automatic method and the blue line-filled bars are results from visual identification method for comparison. From left to right panels the boundary threshold are 0.65, 0.75, and 0.85 of maximum.
Current usage metrics show cumulative count of Article Views (full-text article views including HTML views, PDF and ePub downloads, according to the available data) and Abstracts Views on Vision4Press platform.
Data correspond to usage on the plateform after 2015. The current usage metrics is available 48-96 hours after online publication and is updated daily on week days.
Initial download of the metrics may take a while.