Fig. 2.
Download original image
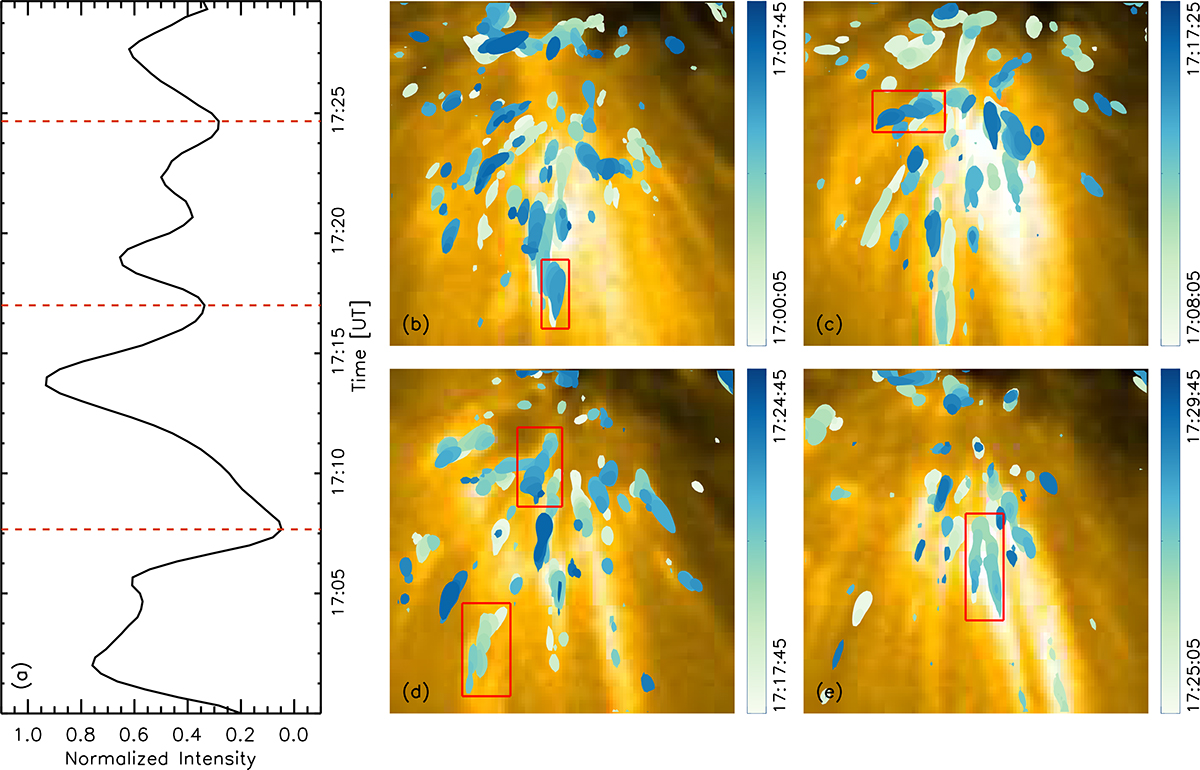
Dynamics at the base of plumes. (a) A sample light curve obtained from the base region of plume 2 (see Figure 1(d)). The whole time period (30 min) is divided into four sections (partitioned at orange dashed lines). (b) – (e) Images of the base region of plume 2 acquired at the middle instance from each temporal section in (a). Brightenings identified using chosen thresholds are marked by the contours (colors indicate time progression; as defined by the color bars). The red boxes highlight several examples of the “gradient patterns”, which are formed by contours from successive frames being adjacent to or overlapping one another, thereby illustrating the movement of the brightenings. Note that, even though we have divided the entire observation into four sub-periods, the contour of the brightenings that appears later will inevitably overlap the ones that appear earlier. For example, a discrete contour could be either a brightening that only appears in one frame, or a brightening that does not show a significant movement.
Current usage metrics show cumulative count of Article Views (full-text article views including HTML views, PDF and ePub downloads, according to the available data) and Abstracts Views on Vision4Press platform.
Data correspond to usage on the plateform after 2015. The current usage metrics is available 48-96 hours after online publication and is updated daily on week days.
Initial download of the metrics may take a while.