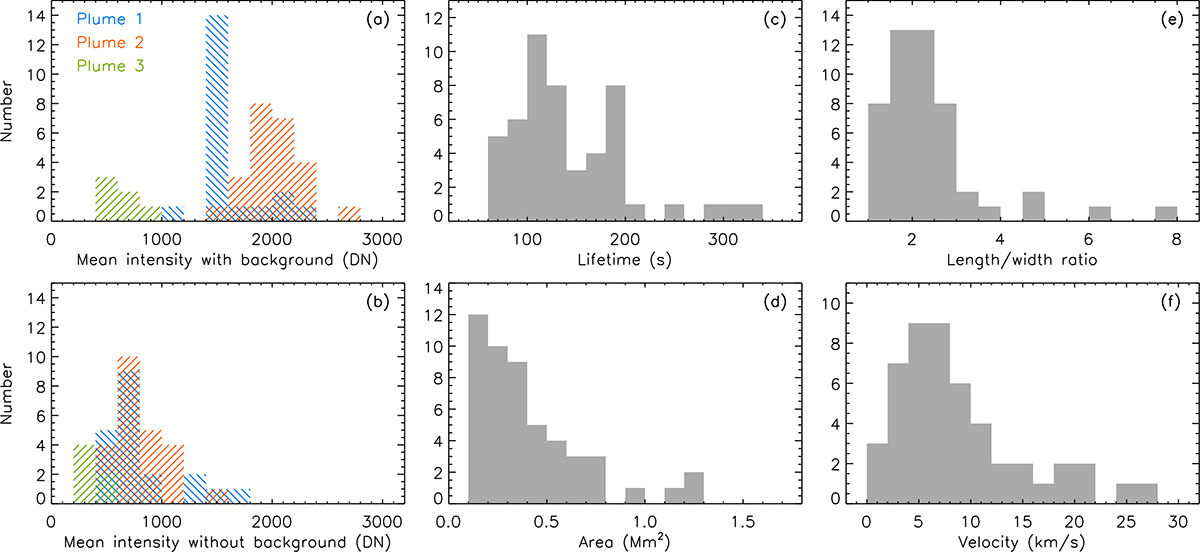
Fig. 4.
Download original image
Distributions of the properties of the base brightenings selected with the visual identification method (50 base brightenings). (a) shows the mean intensity of the base brightenings without subtracting the local background while (b) shows the mean intensity with the local background removed. (c) – (f) show the lifetime, area, length-to-width ratio, and velocity. The velocity here is a projection on the PoS and is calculated using the first and last positions of the intensity-weighted center of the base brightening.
Current usage metrics show cumulative count of Article Views (full-text article views including HTML views, PDF and ePub downloads, according to the available data) and Abstracts Views on Vision4Press platform.
Data correspond to usage on the plateform after 2015. The current usage metrics is available 48-96 hours after online publication and is updated daily on week days.
Initial download of the metrics may take a while.