Fig. 6.
Download original image
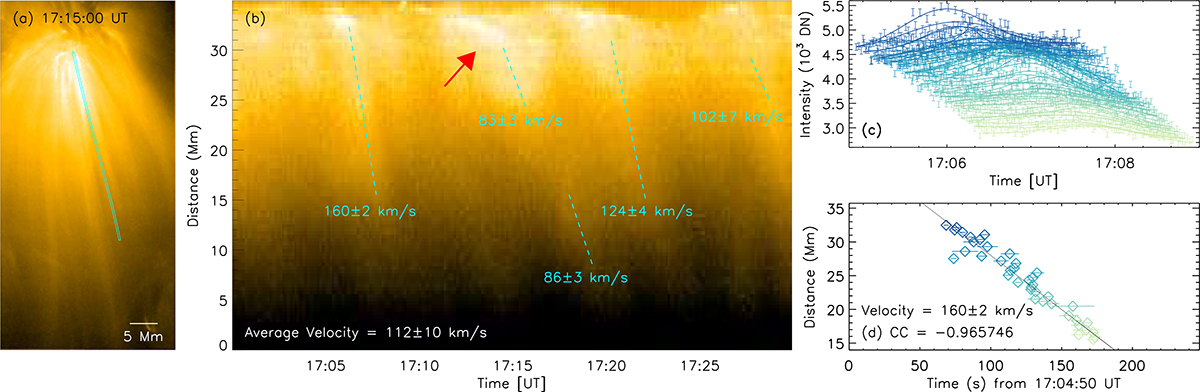
(a) HRIEUV image of plume 2 showing the base region and plume streams. The overplotted box shows the position of the slice that is taken to form the time-slice plot shown in (b). (b) Time-slice plot. The PDs are marked with blue dashed lines. The average velocity is 112 km s−1. The red arrow points to one of the PDs, which is potentially transformed by a slow-moving base brightening. As an example, (c) shows the light curves at different distances (see different colors) of the first PD. The light curves are fitted with a Gaussian function. The central time (where the light curve peaks) derived from the fitting can be found in (d), together with the linear fitting of distances vs. central time. The error of intensity in (c) is calculated taking the readout noise and dark current into account. This error is propagated to get the error of central time in (d). (The associated movie is available online.)
Current usage metrics show cumulative count of Article Views (full-text article views including HTML views, PDF and ePub downloads, according to the available data) and Abstracts Views on Vision4Press platform.
Data correspond to usage on the plateform after 2015. The current usage metrics is available 48-96 hours after online publication and is updated daily on week days.
Initial download of the metrics may take a while.