Fig. 7.
Download original image
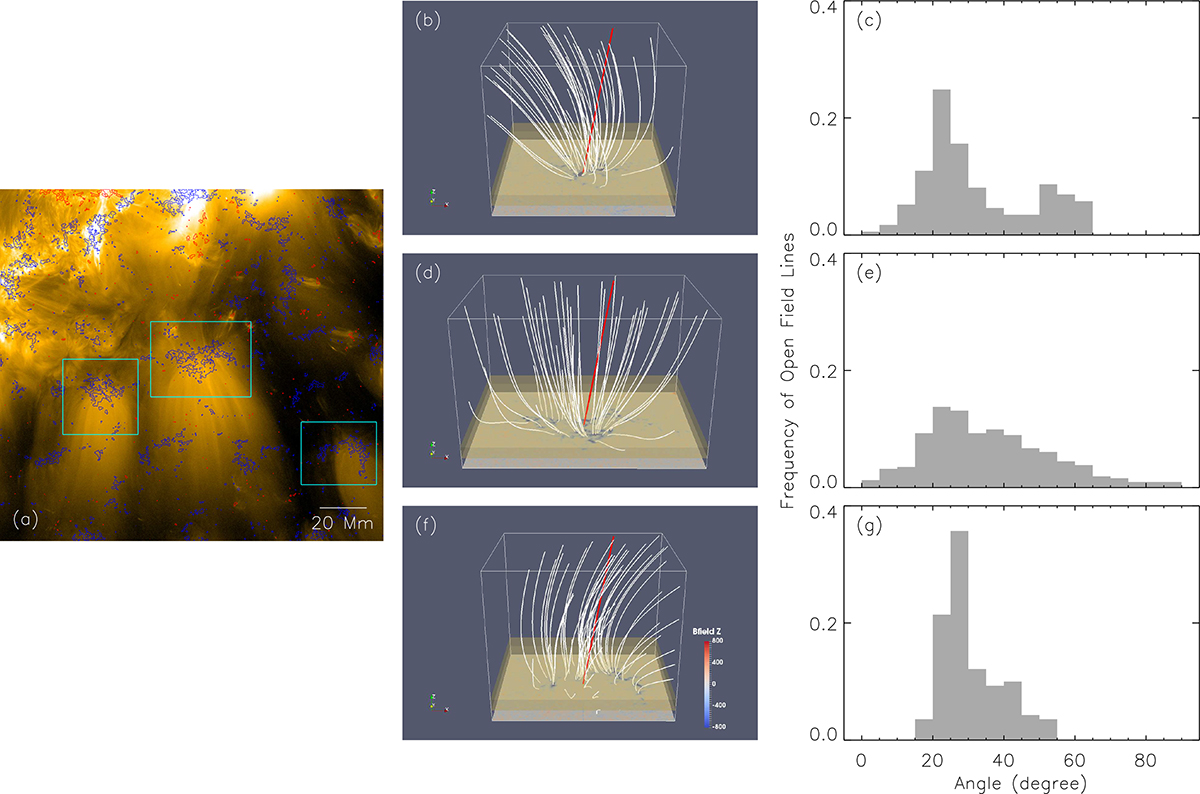
Magnetic field imprints of the plumes. (a) Field of view covered by both HRIEUV and HRT data. The background image comes from the HRIEUV at 17:00 UT. The red (blue) contours of LoS magnetic field with the level of positive (negative) 50 gauss are overplotted. (b), (d) and (f) show the extrapolated magnetic field lines at the location of the three plumes, the sub-regions marked with boxes in (a), (c), (e), and (g) are histograms of frequency of the separation angle between the local magnetic field vector and LoS of three plumes. This separation angle is obtained as an average over all pixels at heights between 2000 and 4000 km along each field line; see the yellow boxes in (b), (d), and (f).
Current usage metrics show cumulative count of Article Views (full-text article views including HTML views, PDF and ePub downloads, according to the available data) and Abstracts Views on Vision4Press platform.
Data correspond to usage on the plateform after 2015. The current usage metrics is available 48-96 hours after online publication and is updated daily on week days.
Initial download of the metrics may take a while.