Fig. 8.
Download original image
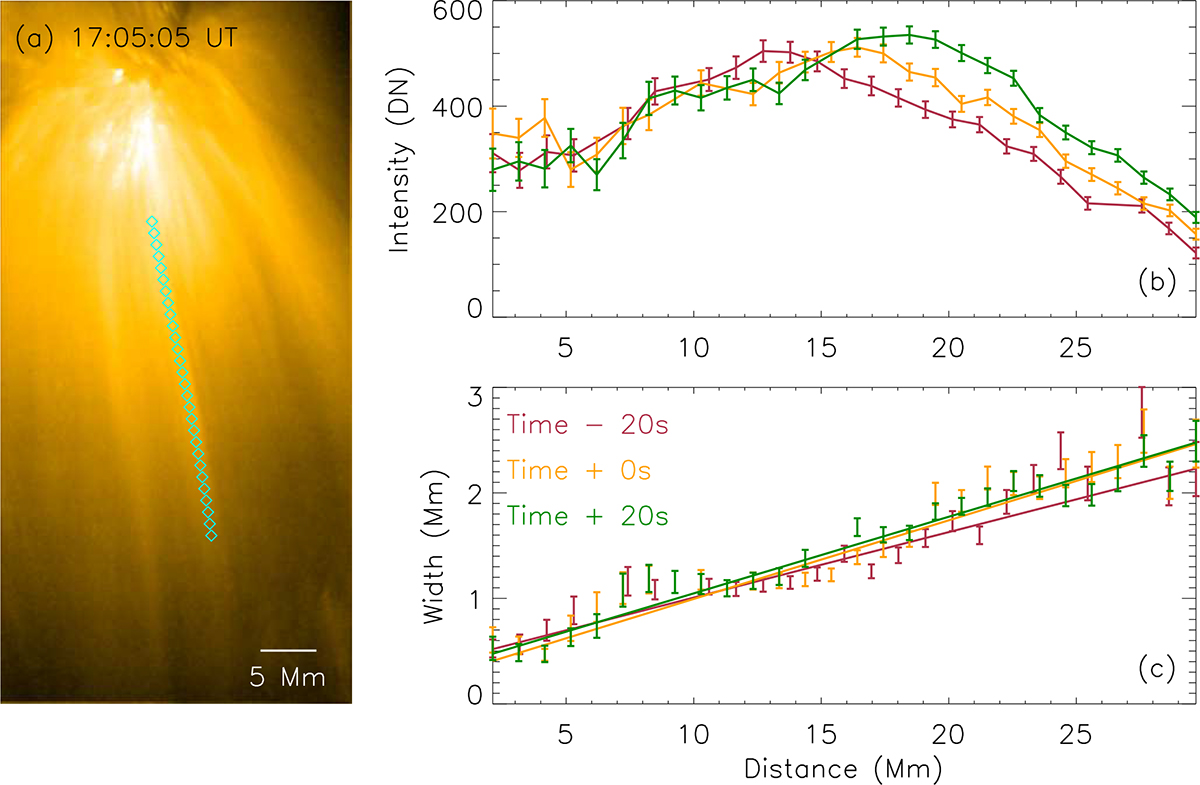
Propagating disturbances. (a) HRIEUV image of plume 2. Positions at different distances from the base region are marked with diamonds. The intensities along the slits perpendicular to the stream direction at these positions are fitted by a Gaussian function. (b) and (c) show the peak and FWHM of the fitted Gaussian functions, as a function of the distance along the PD, at three instances (each separated by 20 s; as identified with different colors). Same as Figure 6c and d, the error of intensity in (b) comes from the detector readout noise and dark current and the error of width is derived from the Gaussian fitting.
Current usage metrics show cumulative count of Article Views (full-text article views including HTML views, PDF and ePub downloads, according to the available data) and Abstracts Views on Vision4Press platform.
Data correspond to usage on the plateform after 2015. The current usage metrics is available 48-96 hours after online publication and is updated daily on week days.
Initial download of the metrics may take a while.