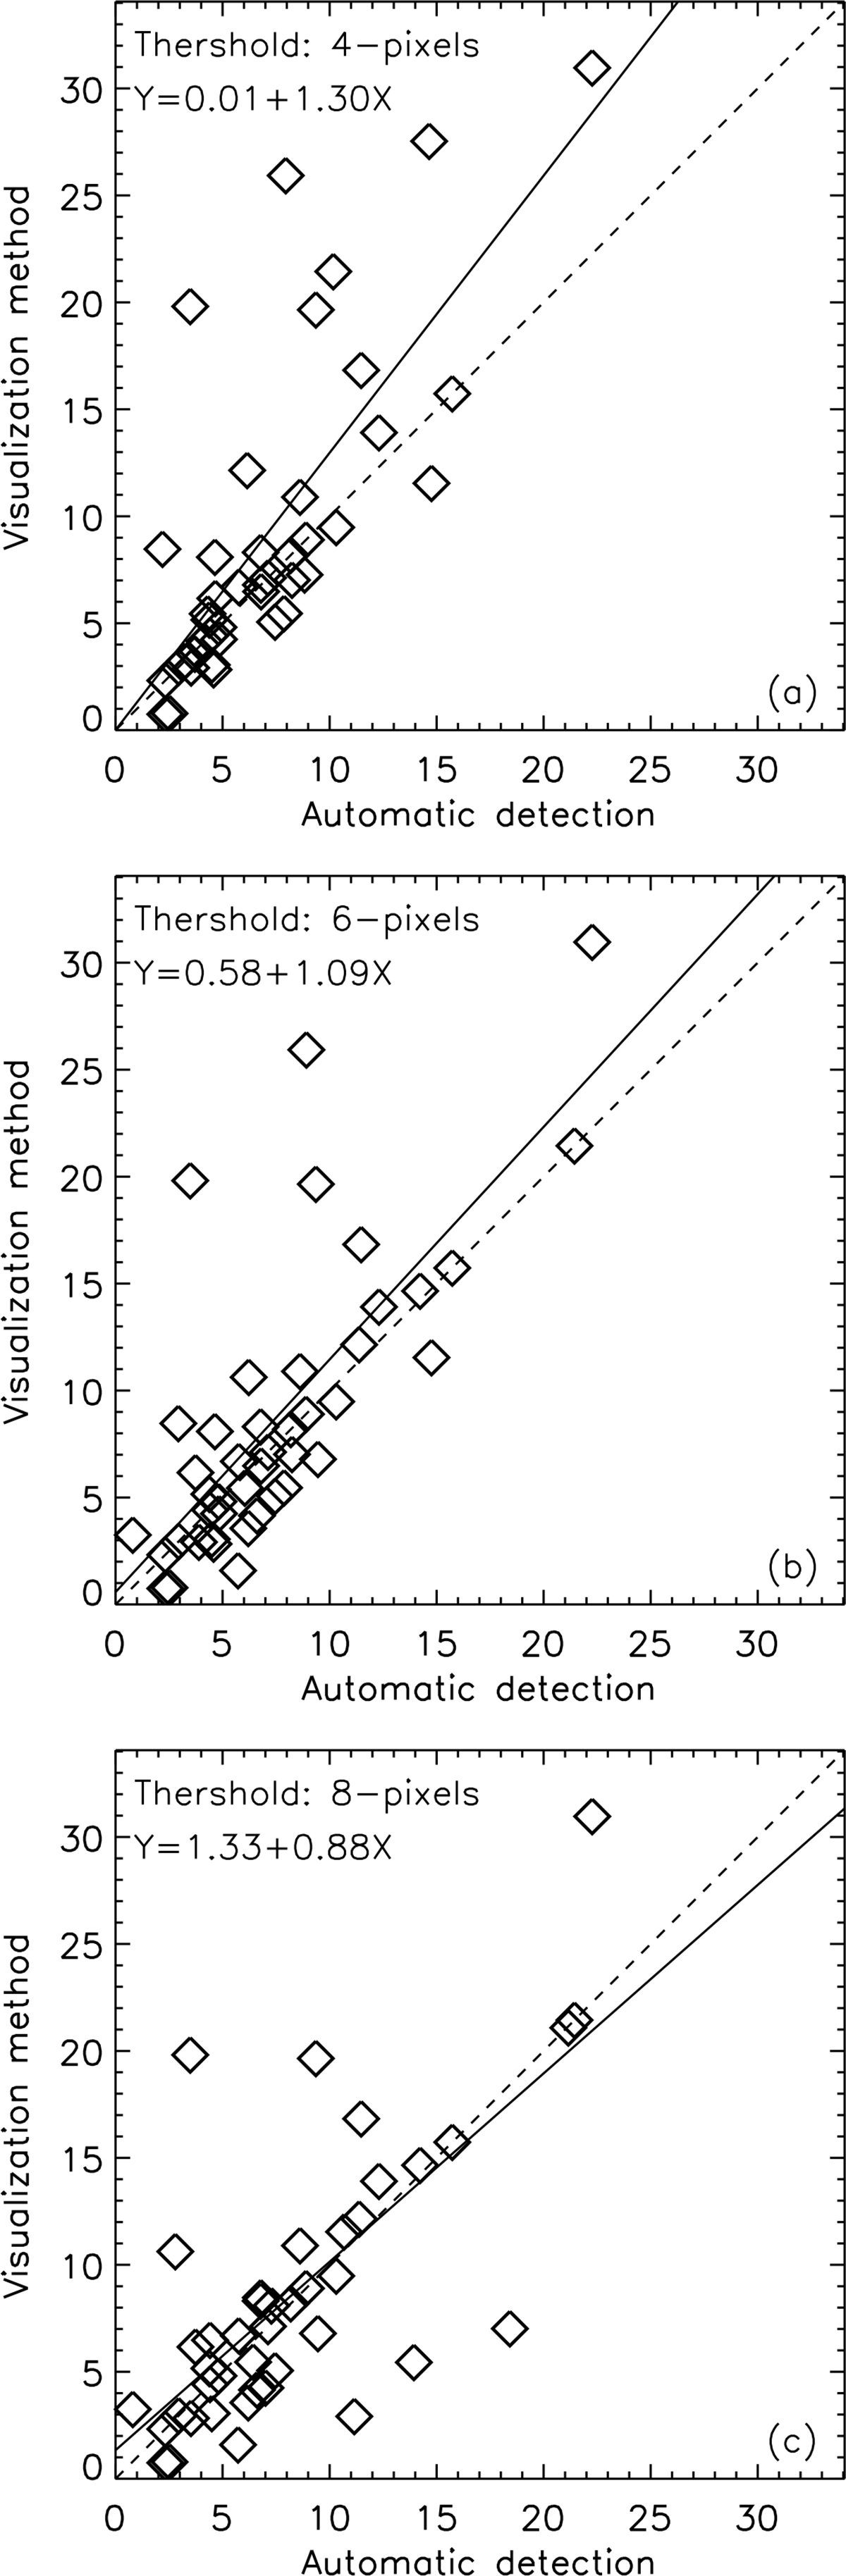
Fig. A.1.
Download original image
Scatter plots showing correlations of the velocities of the same structure obtained from different methods. In (a), (b), and (c), the threshold describing the neighborhood in which we searched in the following frame for the moving brightening is set to 4 pixels, 6 pixels, and 8 pixels separately. The dashed diagonals show the ideal case of equal velocities from both methods, while the solid lines are the linear fittings. The fitting parameters can be seen in the upper left corner of each panel.
Current usage metrics show cumulative count of Article Views (full-text article views including HTML views, PDF and ePub downloads, according to the available data) and Abstracts Views on Vision4Press platform.
Data correspond to usage on the plateform after 2015. The current usage metrics is available 48-96 hours after online publication and is updated daily on week days.
Initial download of the metrics may take a while.