Fig. 1.
Download original image
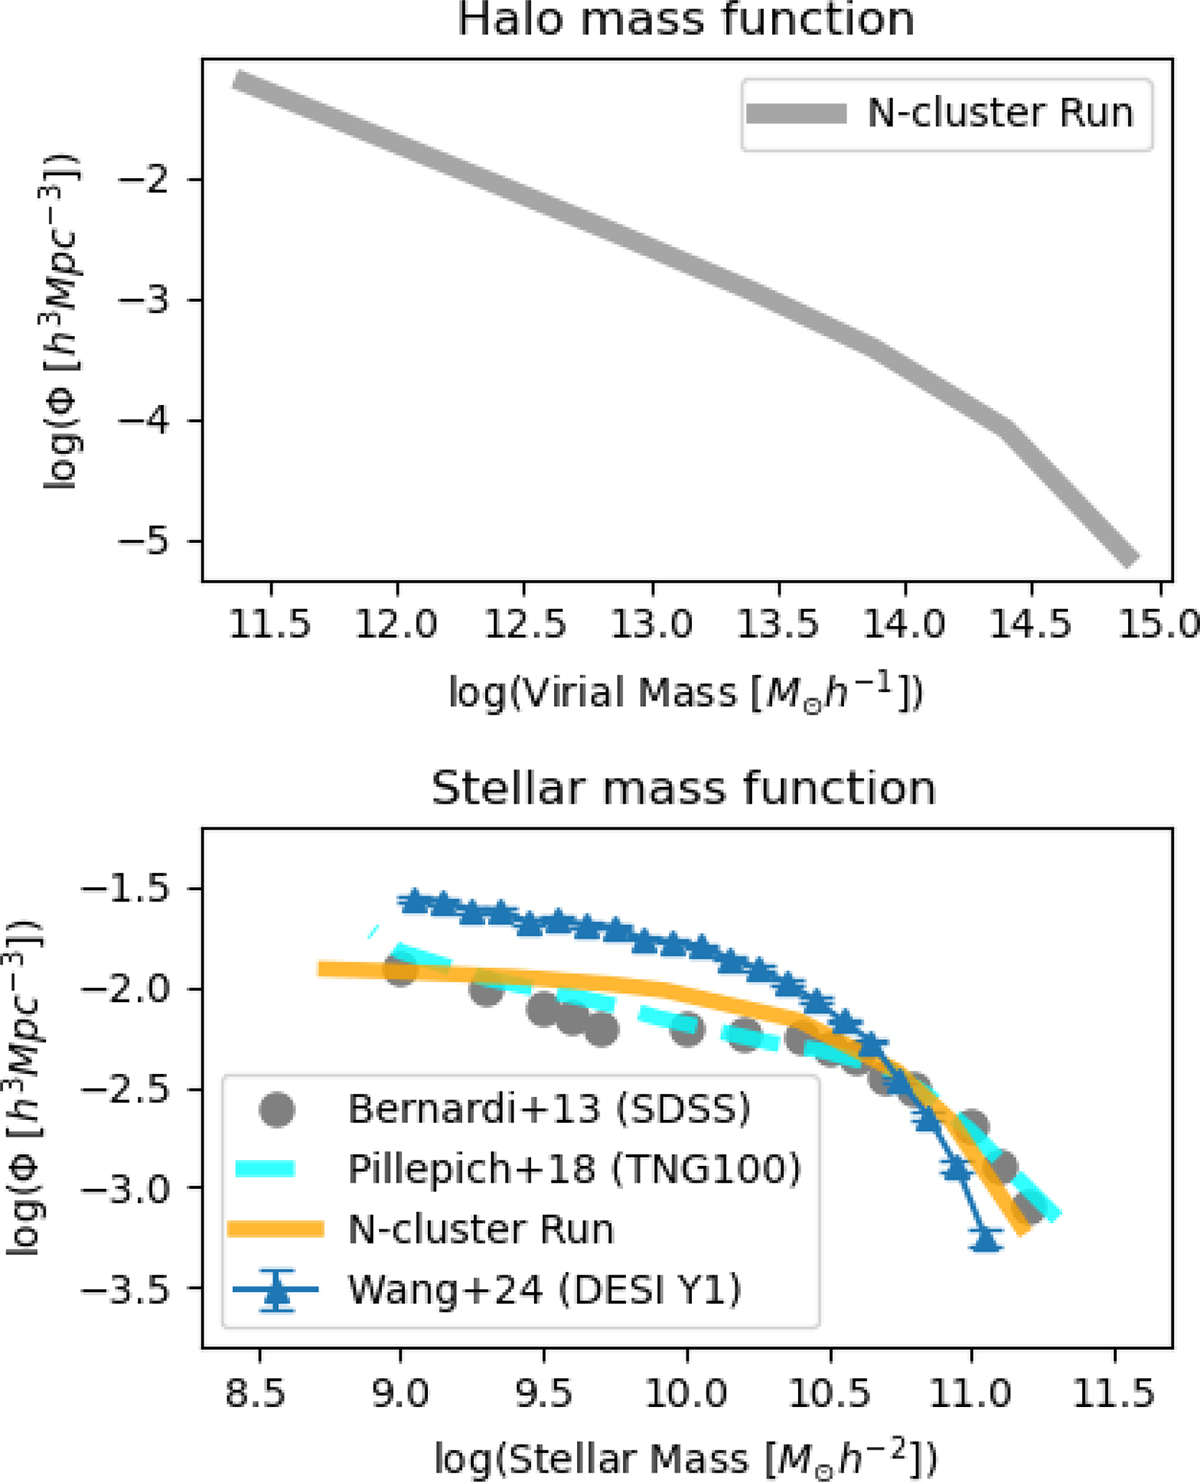
Top: Halo mass function of N-cluster Run simulation. Bottom: Comparison with stellar mass function of the N-cluster Run simulation and other studies. The Orange solid and cyan dashed lines represent the simulation function from the N-cluster Run and the Illustris-TNG 100 simulation (Pillepich et al. 2018). Gray circles and blue triangles are observational function from SDSS (Bernardi et al. 2013) and DESI Y1 data (Wang et al. 2024).
Current usage metrics show cumulative count of Article Views (full-text article views including HTML views, PDF and ePub downloads, according to the available data) and Abstracts Views on Vision4Press platform.
Data correspond to usage on the plateform after 2015. The current usage metrics is available 48-96 hours after online publication and is updated daily on week days.
Initial download of the metrics may take a while.