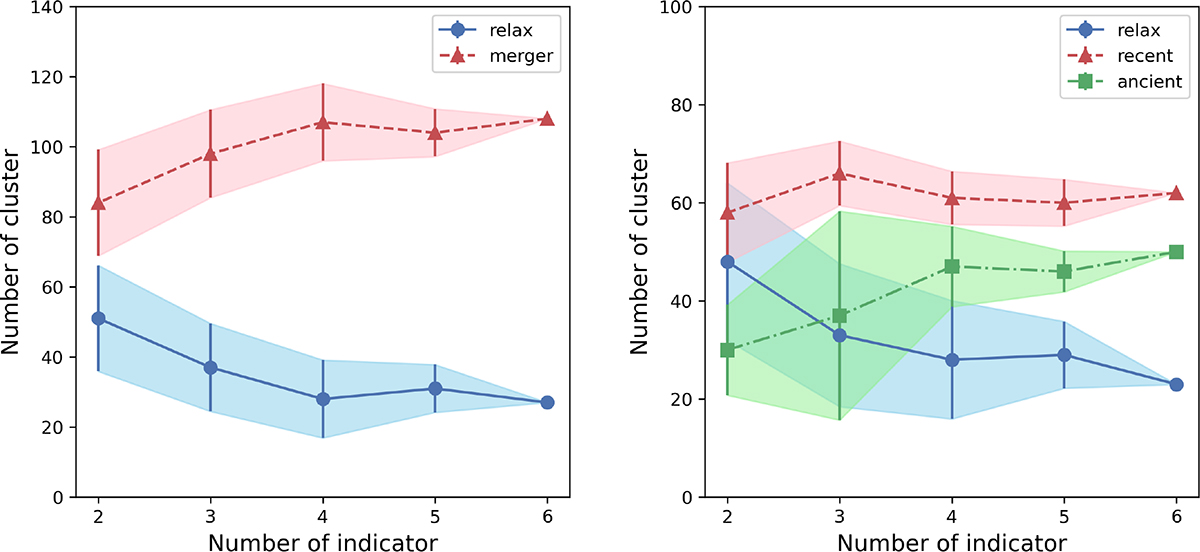
Fig. 10.
Download original image
Classification number of cluster tendency by number of combined indicators. Left: Projected model results for two merger stage classifications. Right: Projection model results for three merger stage classifications. Different colors, symbols, and line styles represent different merger stages, and it can be checked in the legend.
Current usage metrics show cumulative count of Article Views (full-text article views including HTML views, PDF and ePub downloads, according to the available data) and Abstracts Views on Vision4Press platform.
Data correspond to usage on the plateform after 2015. The current usage metrics is available 48-96 hours after online publication and is updated daily on week days.
Initial download of the metrics may take a while.