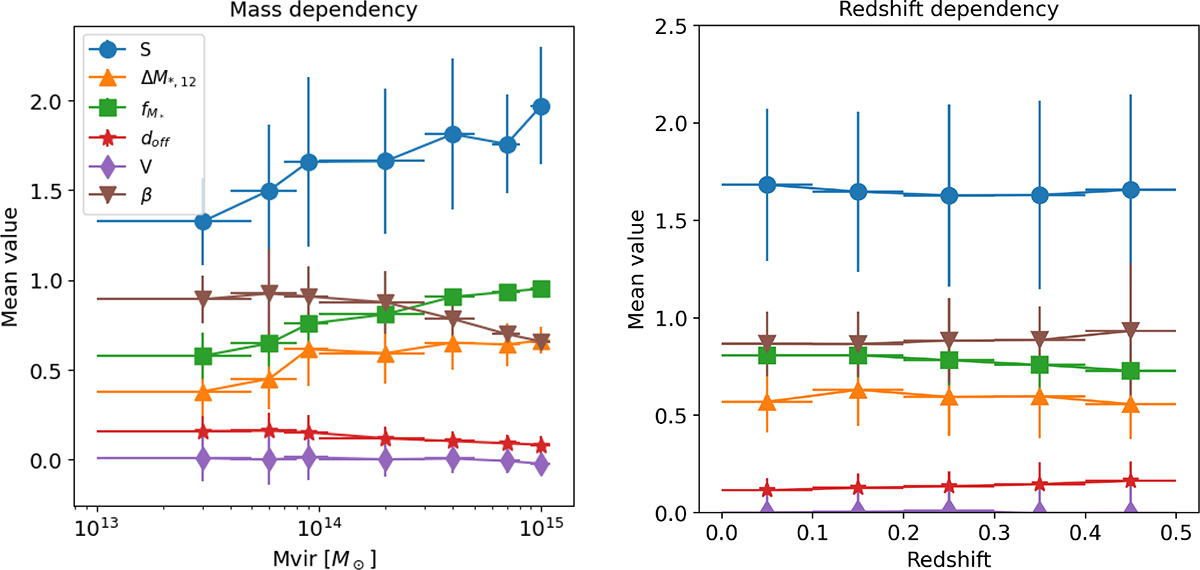
Fig. 11.
Download original image
Left: Mass dependency of six dynamical state indicators. Each color and shape of symbols represent different dynamical state indicators. Sort of indicator can check in the legend. Detailed information of indicators is in section 3.1. X error shows bin size and y error shows standard deviation of values within bin. Right: Redshift dependency of six dynamical state indicators. Features are same with left panel.
Current usage metrics show cumulative count of Article Views (full-text article views including HTML views, PDF and ePub downloads, according to the available data) and Abstracts Views on Vision4Press platform.
Data correspond to usage on the plateform after 2015. The current usage metrics is available 48-96 hours after online publication and is updated daily on week days.
Initial download of the metrics may take a while.