Open Access
Fig. 2.
Download original image
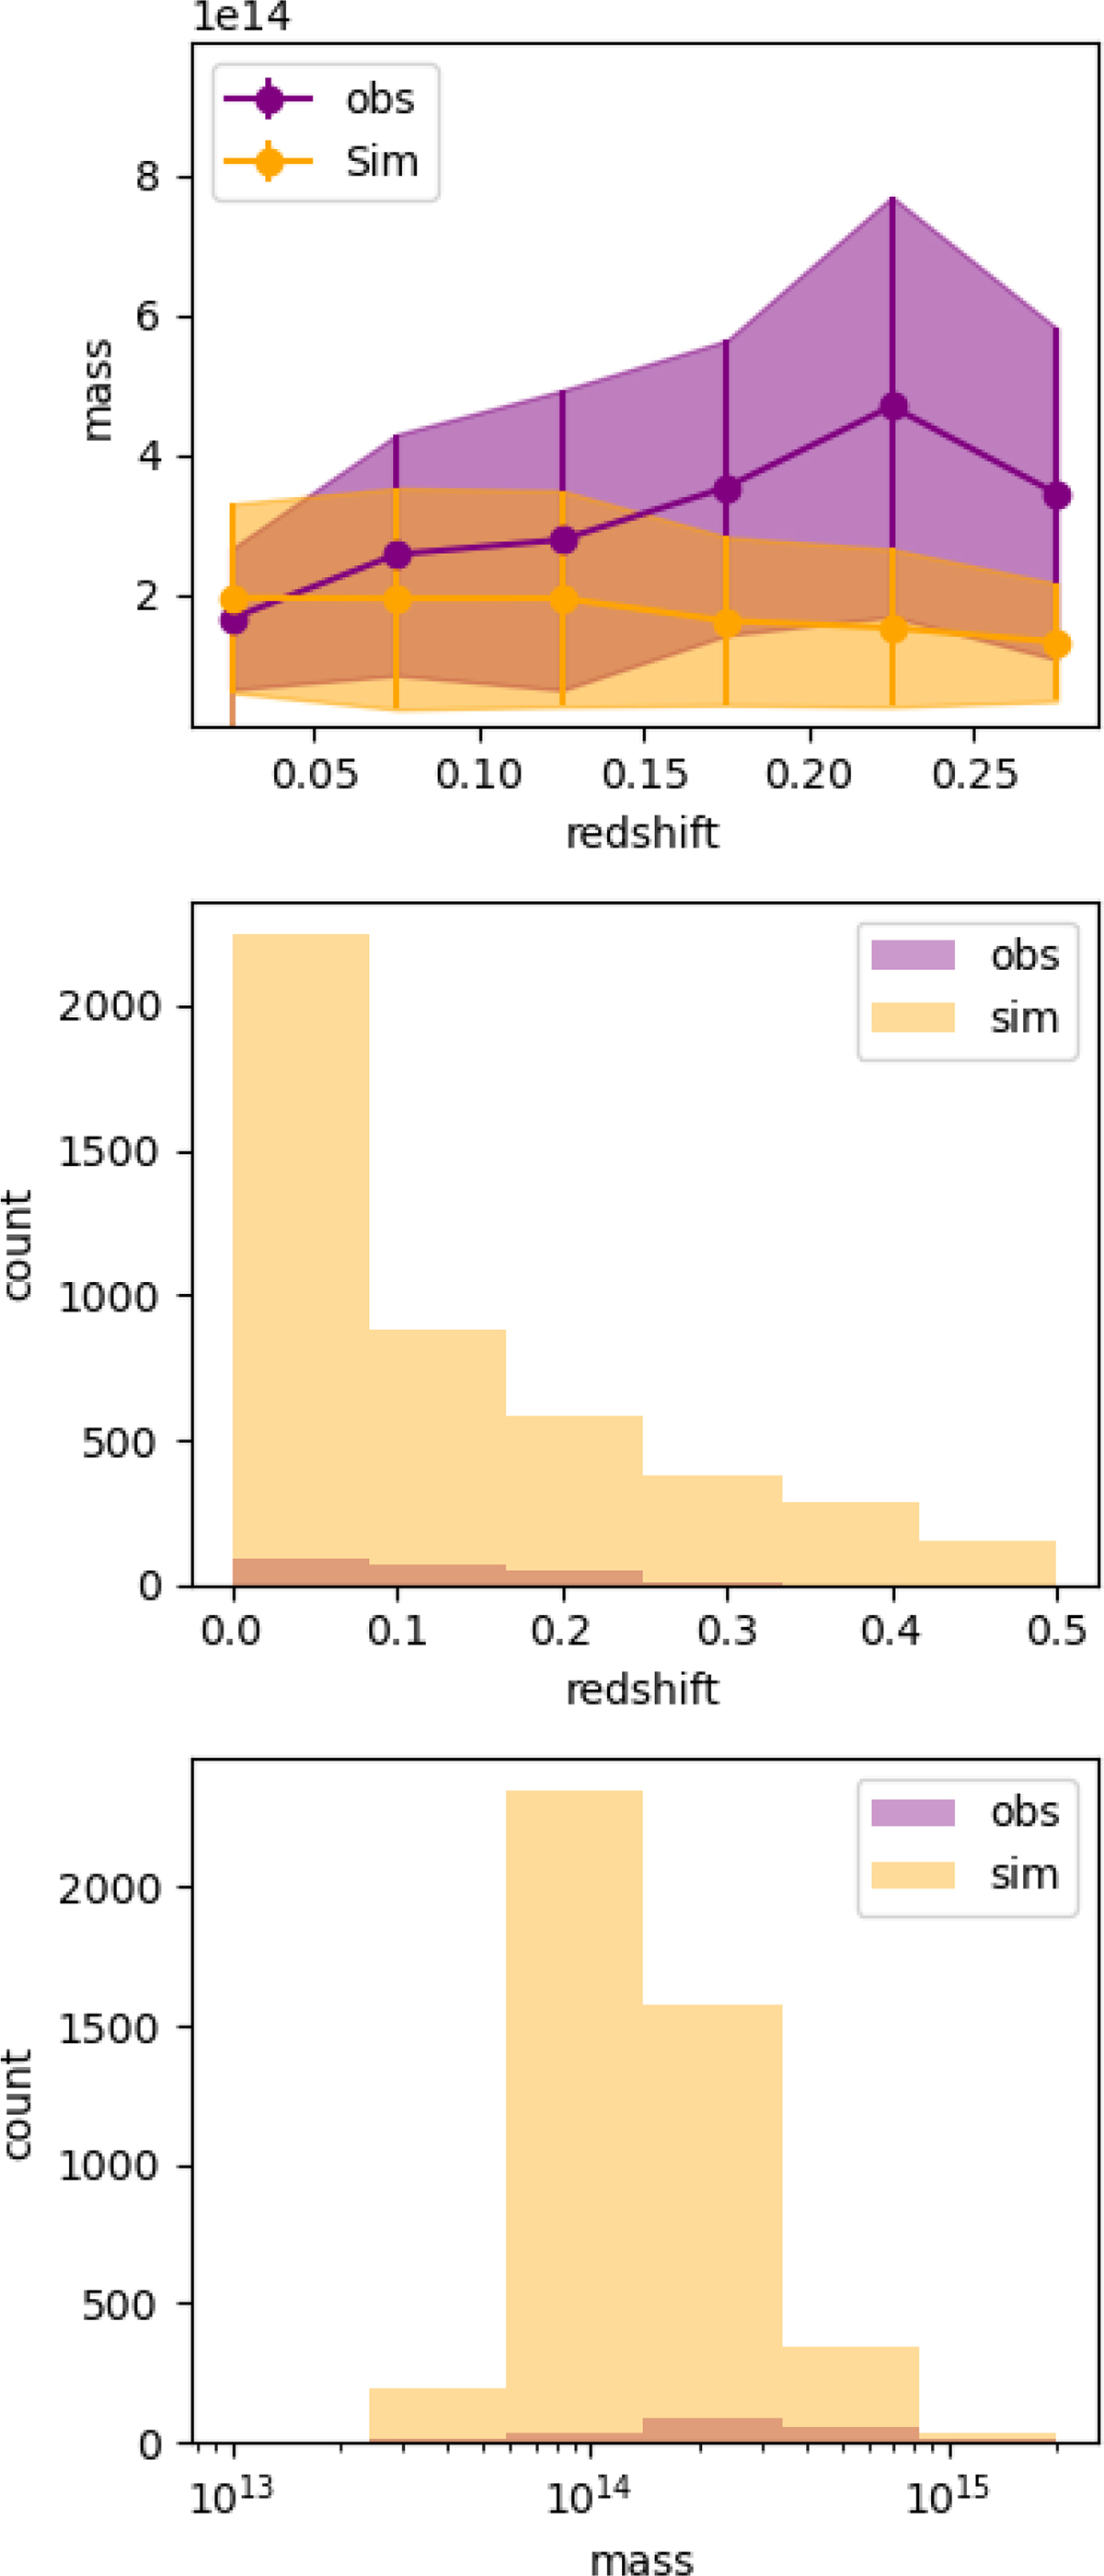
Top: Mass versus redshift distribution of simulation data and observation data. Dots show median values, and the shaded area shows standard deviation values within redshift bins. Middle: Histogram of redshift for both observation and simulation data. Bottom: Histogram of Mass for both observation and simulation data.
Current usage metrics show cumulative count of Article Views (full-text article views including HTML views, PDF and ePub downloads, according to the available data) and Abstracts Views on Vision4Press platform.
Data correspond to usage on the plateform after 2015. The current usage metrics is available 48-96 hours after online publication and is updated daily on week days.
Initial download of the metrics may take a while.