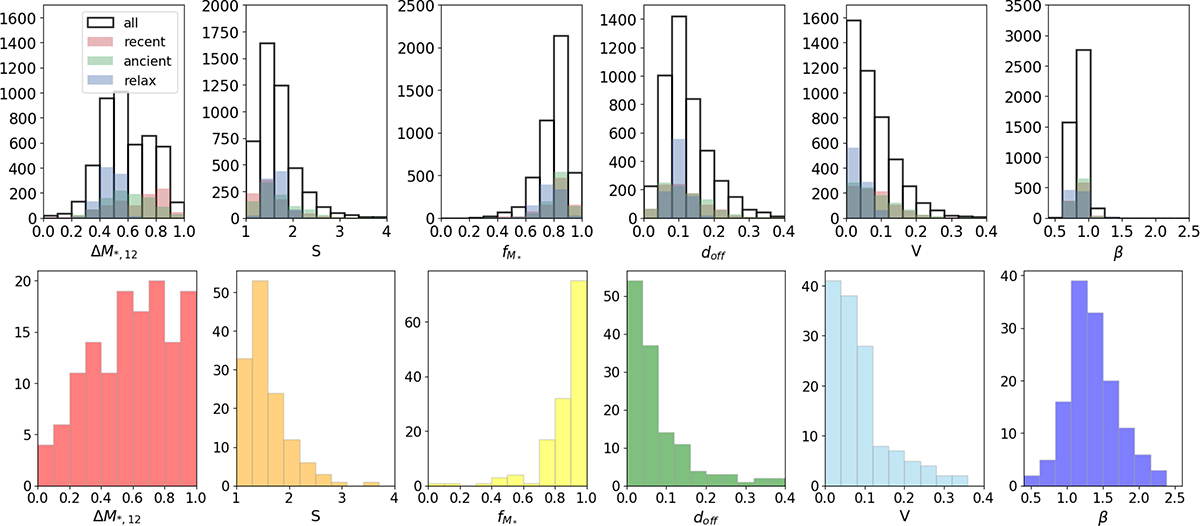
Fig. 3.
Download original image
Histograms of six dynamical state indicators on (Top) N-cluster Run simulation and (Bottom) HeCS observation data. Top: Black empty, red, green, and blue colored histograms exhibit the number of galaxy clusters for total, recent merger, ancient merger, and relaxed dynamical state, respectively. The overlap of the merger and relaxed sample histogram distribution shows the projection effects on each dynamical state indicator. Bottom: Same indicator histograms as the top panels with different colors. Even though there are slight parameter range differences, the overall parameter distribution seems similar to each other.
Current usage metrics show cumulative count of Article Views (full-text article views including HTML views, PDF and ePub downloads, according to the available data) and Abstracts Views on Vision4Press platform.
Data correspond to usage on the plateform after 2015. The current usage metrics is available 48-96 hours after online publication and is updated daily on week days.
Initial download of the metrics may take a while.