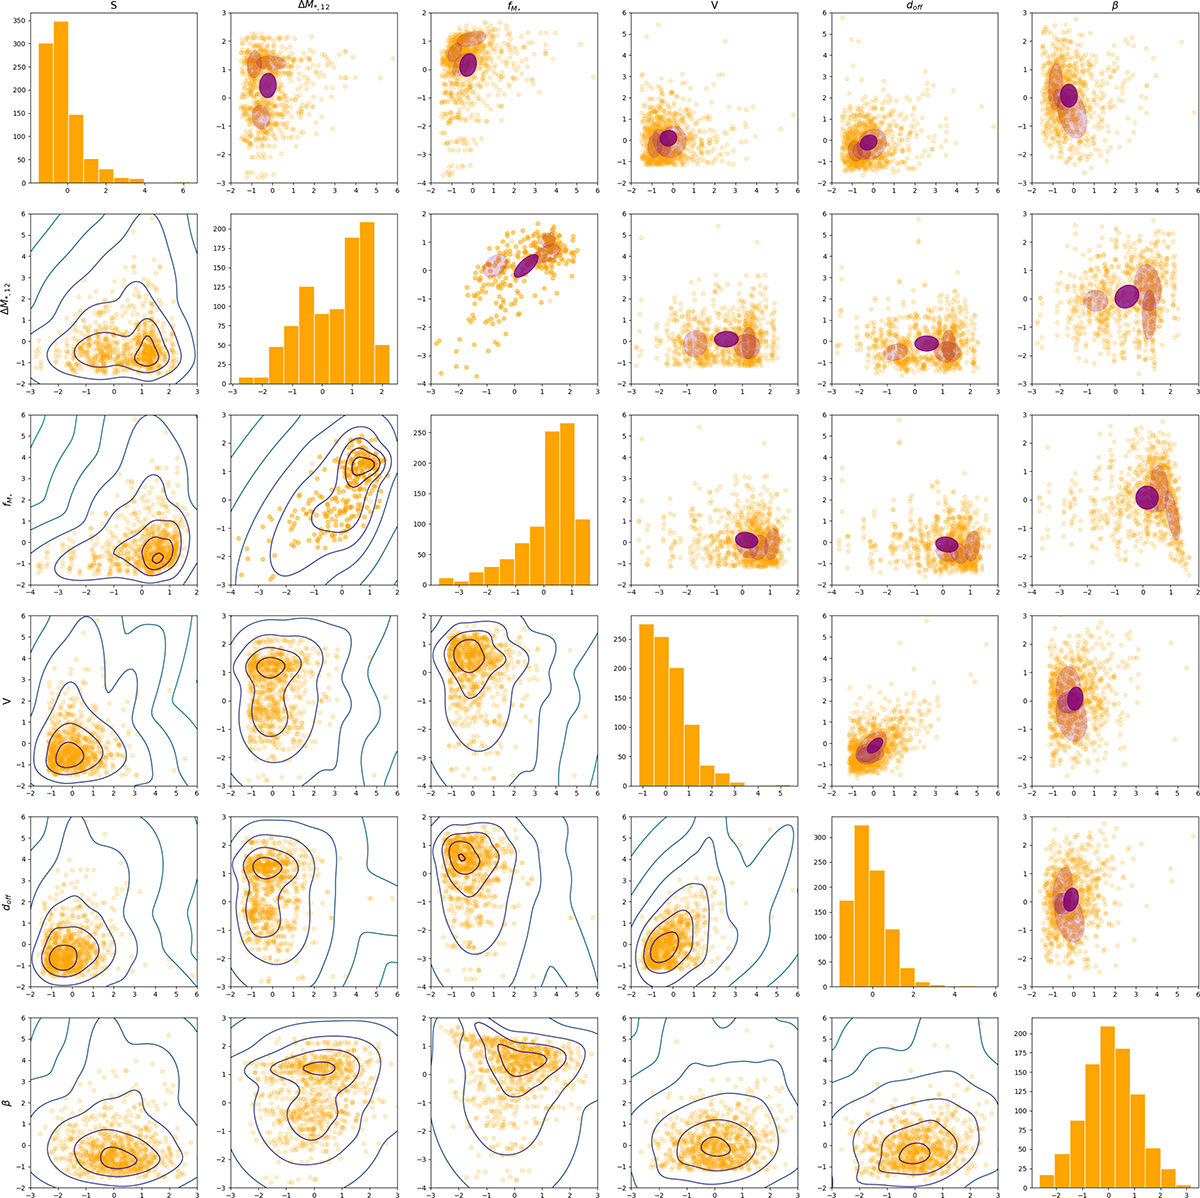
Fig. 4.
Download original image
2D Correlation plots for each indicator distribution by merger sample. The bottom-left corner and top-right corner give the scatter plots of the indicator against the other. The diagonal shows the histogram of individual indicators. In the bottom-left panels, we overplot probability contours (varying probability value in each panel). In the top-right corner, we overplot ellipses indicating the shape of the Gaussian for all components with a weight concentration prior > 0.1. We note that ellipses match the location of the high probability contours.
Current usage metrics show cumulative count of Article Views (full-text article views including HTML views, PDF and ePub downloads, according to the available data) and Abstracts Views on Vision4Press platform.
Data correspond to usage on the plateform after 2015. The current usage metrics is available 48-96 hours after online publication and is updated daily on week days.
Initial download of the metrics may take a while.