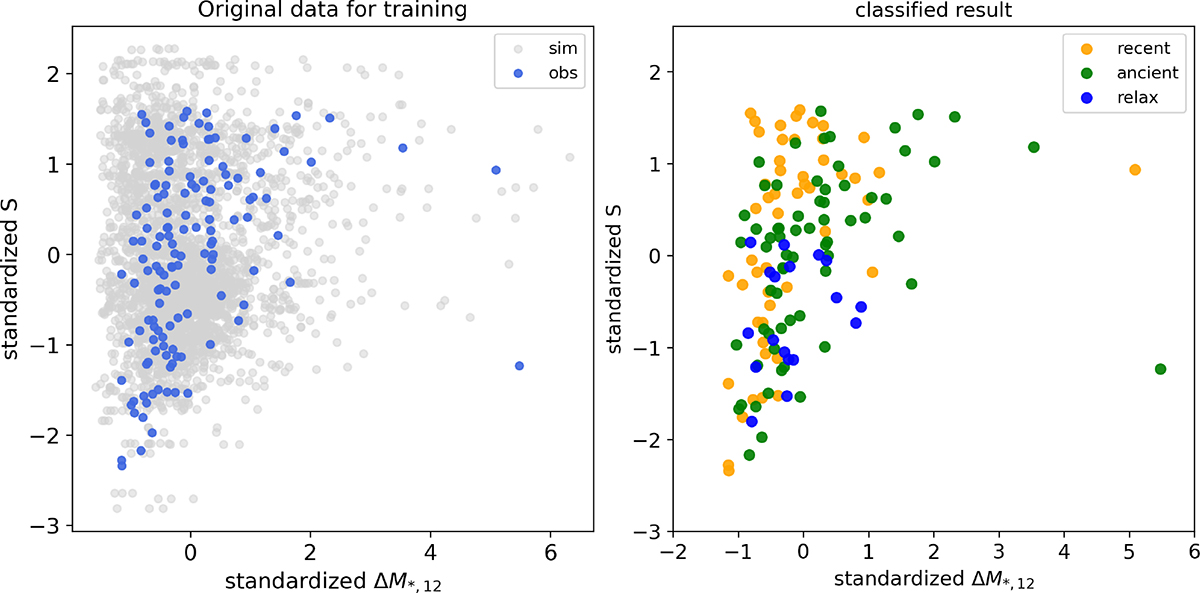
Fig. 7.
Download original image
Example figures for a modeled Bayesian classifier application on the observation data. Again, figures are 2D, but the actual classifier was made in a 6D indicator space. Left: Original 2D observation data distribution. Classifier was modeled using simulation data distribution (white), and then the trained classifier is applied to observation data (Blue). Right: classified results of observation data. Each color represents different merger stages, and check it in legend.
Current usage metrics show cumulative count of Article Views (full-text article views including HTML views, PDF and ePub downloads, according to the available data) and Abstracts Views on Vision4Press platform.
Data correspond to usage on the plateform after 2015. The current usage metrics is available 48-96 hours after online publication and is updated daily on week days.
Initial download of the metrics may take a while.