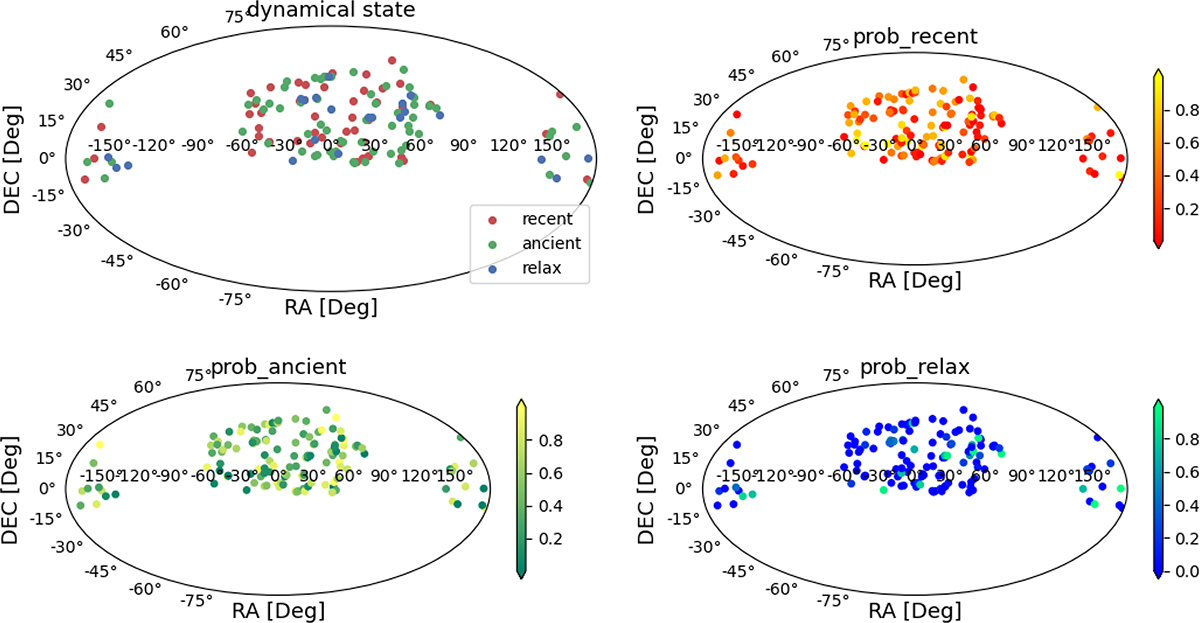
Fig. 8.
Download original image
Spatial distributions of 135 classified observation clusters. Top-left: Dichotomy classification result. Red, green, and blue circles represent recent merger stage, ancient merger stage, and relaxed state clusters. From the top-right to the bottom of figure, the color gradient shows probabilities of recent merger (red, top-right), ancient merger (green, bottom-left), and relaxed state (blue, bottom-right).
Current usage metrics show cumulative count of Article Views (full-text article views including HTML views, PDF and ePub downloads, according to the available data) and Abstracts Views on Vision4Press platform.
Data correspond to usage on the plateform after 2015. The current usage metrics is available 48-96 hours after online publication and is updated daily on week days.
Initial download of the metrics may take a while.