Fig. 9.
Download original image
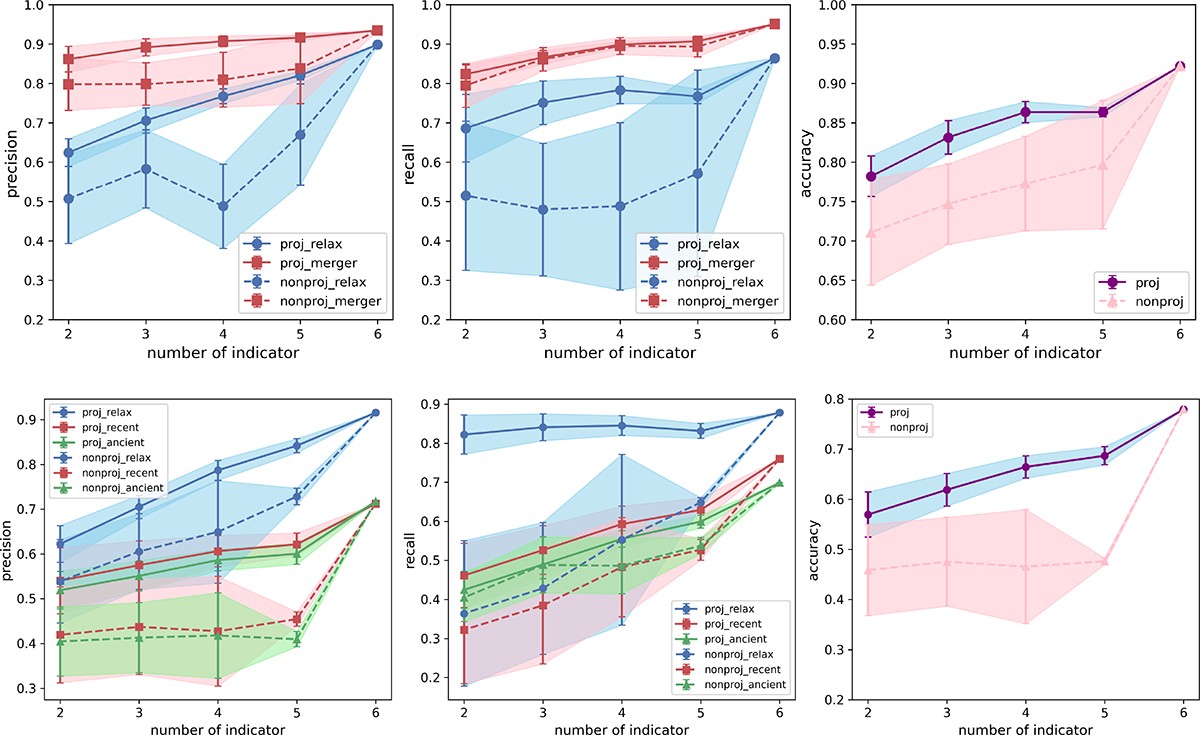
Precision, recall, and accuracy changes by number of combined indicators. The upper three plots show results from two merger stage classifications (merger and relax), and the lower three plots show results from three merger stage classifications. From Left to right columns, precision, recall, and accuracy results were shown. Each color of line represents a different merger stage, which can be identified in the legend. The solid line and dashed line indicate the projected classifier and non-projected classifier results, respectively. Shade shows scatter from different indicator combinations.
Current usage metrics show cumulative count of Article Views (full-text article views including HTML views, PDF and ePub downloads, according to the available data) and Abstracts Views on Vision4Press platform.
Data correspond to usage on the plateform after 2015. The current usage metrics is available 48-96 hours after online publication and is updated daily on week days.
Initial download of the metrics may take a while.