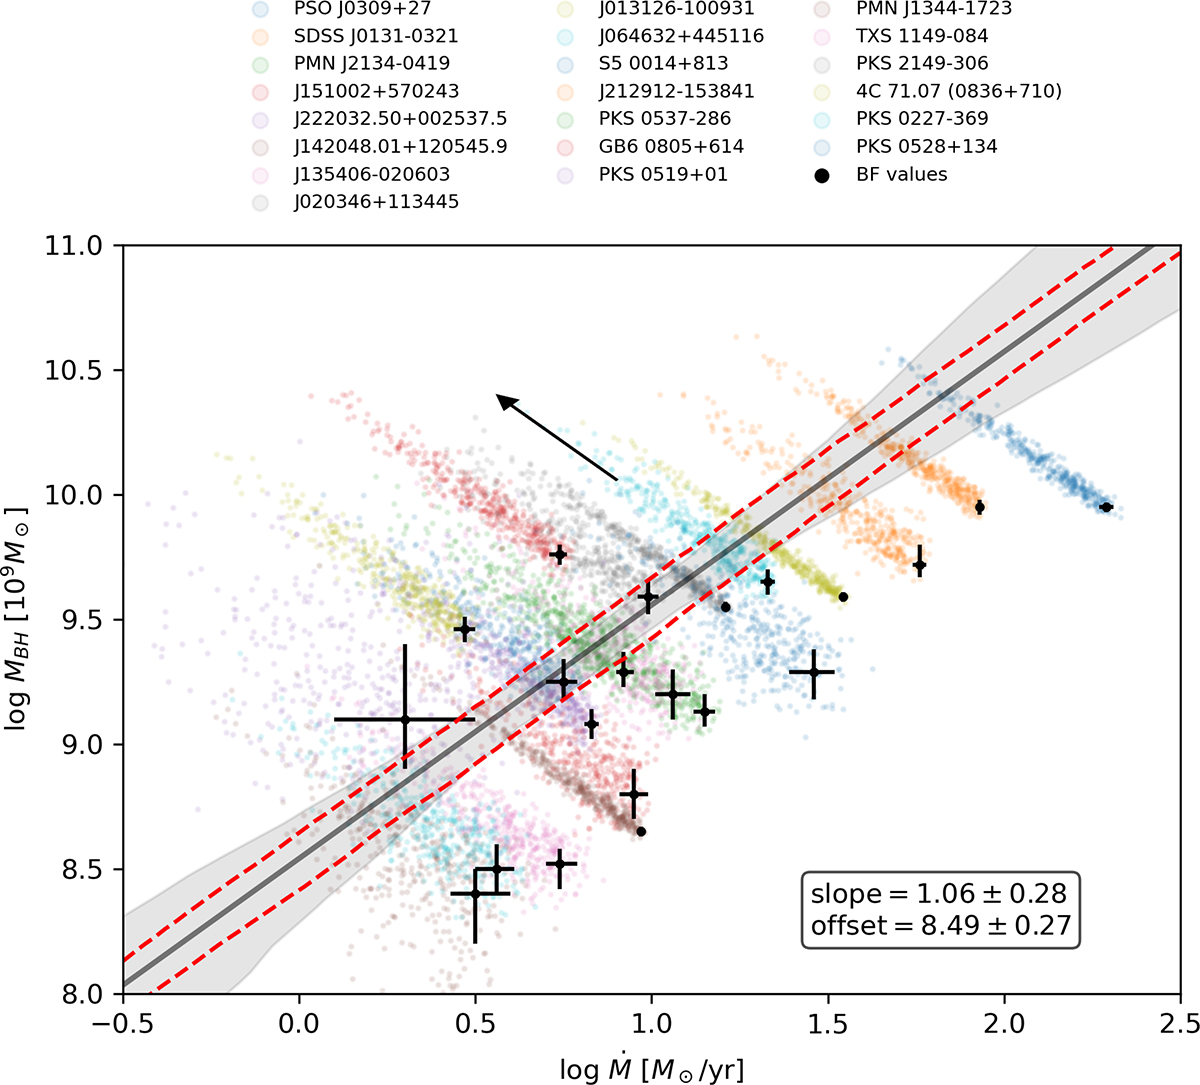
Fig. D.1.
Download original image
Log-log plot of MBH and Ṁ plot based on our fit results assuming zero BH spin (black points indicate the median values from the posterior distributions). Colored clouds are computed based on statistical uncertainties of the fit, as well as a correction for uniform spin following Eq. D.2 that causes a scatter in the direction of the arrow (see text for details). The population is fit by a linear model defined in Eq. D.1. The median and the 68% credible region are marked by the gray line and the shaded region respectively. Red lines mark the median excess scatter predicted by the fit due to BH spin uncertainty.
Current usage metrics show cumulative count of Article Views (full-text article views including HTML views, PDF and ePub downloads, according to the available data) and Abstracts Views on Vision4Press platform.
Data correspond to usage on the plateform after 2015. The current usage metrics is available 48-96 hours after online publication and is updated daily on week days.
Initial download of the metrics may take a while.