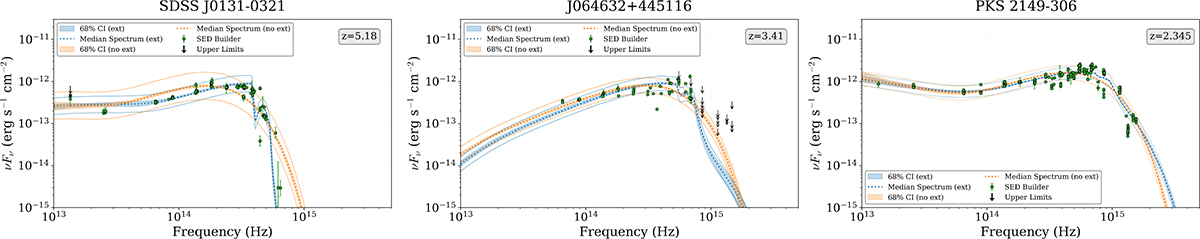
Fig. 2.
Download original image
Infrared-to-ultraviolet SEDs of three high-z blazars (in the observer frame). Green points indicate publicly available photometric observations from the ASI SSDC SED builder (Stratta et al. 2011). Upper limits are plotted with black arrows. Model fits with and without IGM extinction are plotted with blue and orange colors, respectively. Dark shaded regions indicate the 68 percent confidence intervals. Thin solid lines indicate the range of model expectations accounting for the intrinsic scatter described by the parameter lnf. All sources, except for J064632+445116, are fit with a two-component (jet plus disk) model.
Current usage metrics show cumulative count of Article Views (full-text article views including HTML views, PDF and ePub downloads, according to the available data) and Abstracts Views on Vision4Press platform.
Data correspond to usage on the plateform after 2015. The current usage metrics is available 48-96 hours after online publication and is updated daily on week days.
Initial download of the metrics may take a while.