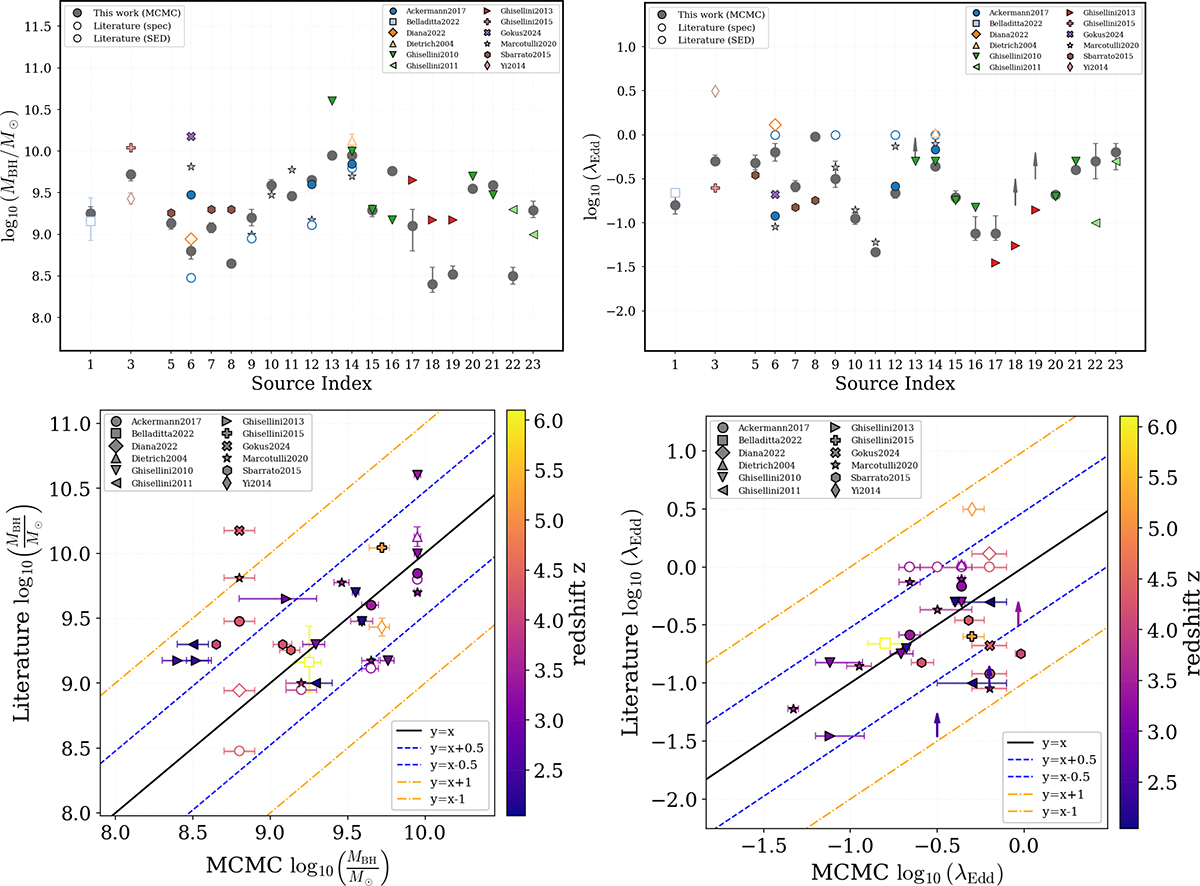
Fig. 5.
Download original image
Comparison between our MCMC estimates (including extinction) and literature values for black hole mass MBH (left column) and Eddington ratio λEdd (right column). Top left panel: Black hole mass estimates for each source (x axis index) from our MCMC (black circles) and literature (colored markers; open symbols for spectroscopic and filled for SED-fitting estimates). Error bars show 68% uncertainties. Marker shapes indicate different literature sources. Top right panel: Eddington ratio comparison, using the same visual coding as the left panel. Bottom left panel: Direct comparison of black hole mass estimates between our MCMC method (x axis) and literature values (y axis). Points are colored by source redshift z, and marker shapes indicate literature sources. Open symbols represent spectroscopic measurements, while filled symbols denote SED-fitting estimates. We show the MCMC uncertainties (68% confidence). Bottom right panel: Eddington ratio comparison using the same format, redshift coloring, and marker coding system. In the bottom panels, lines are overplotted to guide the eye (see inset legend). Blazars B2 1023+25 and GB6 B1428+4217 are not shown for reasons explained in Appendix B. Upward-pointing arrows indicate lower limits on the MCMC Eddington ratio estimates for the sources marked in B.1.
Current usage metrics show cumulative count of Article Views (full-text article views including HTML views, PDF and ePub downloads, according to the available data) and Abstracts Views on Vision4Press platform.
Data correspond to usage on the plateform after 2015. The current usage metrics is available 48-96 hours after online publication and is updated daily on week days.
Initial download of the metrics may take a while.