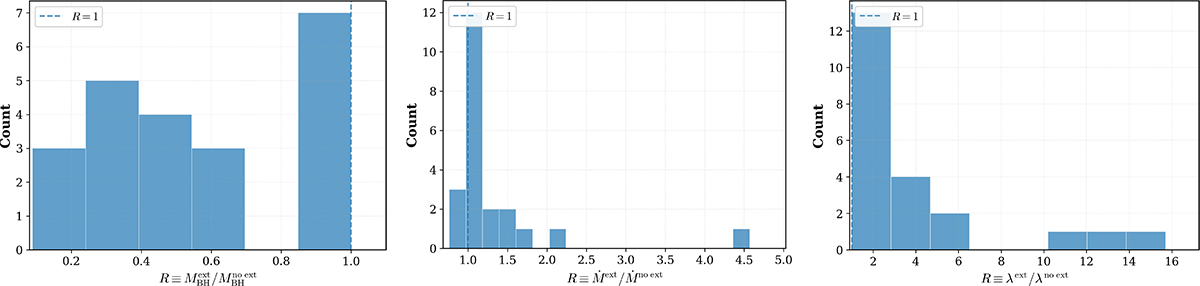
Fig. B.1.
Download original image
Ratios of quantities derived with and without accounting for extinction. The top row shows the ratio of black hole masses (left) and the ratio of accretion rates (right), while the bottom panel shows the ratio of Eddington ratios. The dashed black vertical line at R = 1 corresponds to no change between the two fits. These plots highlight the systematic trend: neglecting extinction leads to overestimates of black hole masses and underestimates of Eddington ratios. The blazars B2 1023+25 and GB6 B1428+4217 are excluded from this figure because of reasons explained in Appendix B.
Current usage metrics show cumulative count of Article Views (full-text article views including HTML views, PDF and ePub downloads, according to the available data) and Abstracts Views on Vision4Press platform.
Data correspond to usage on the plateform after 2015. The current usage metrics is available 48-96 hours after online publication and is updated daily on week days.
Initial download of the metrics may take a while.