Fig. 1
Download original image
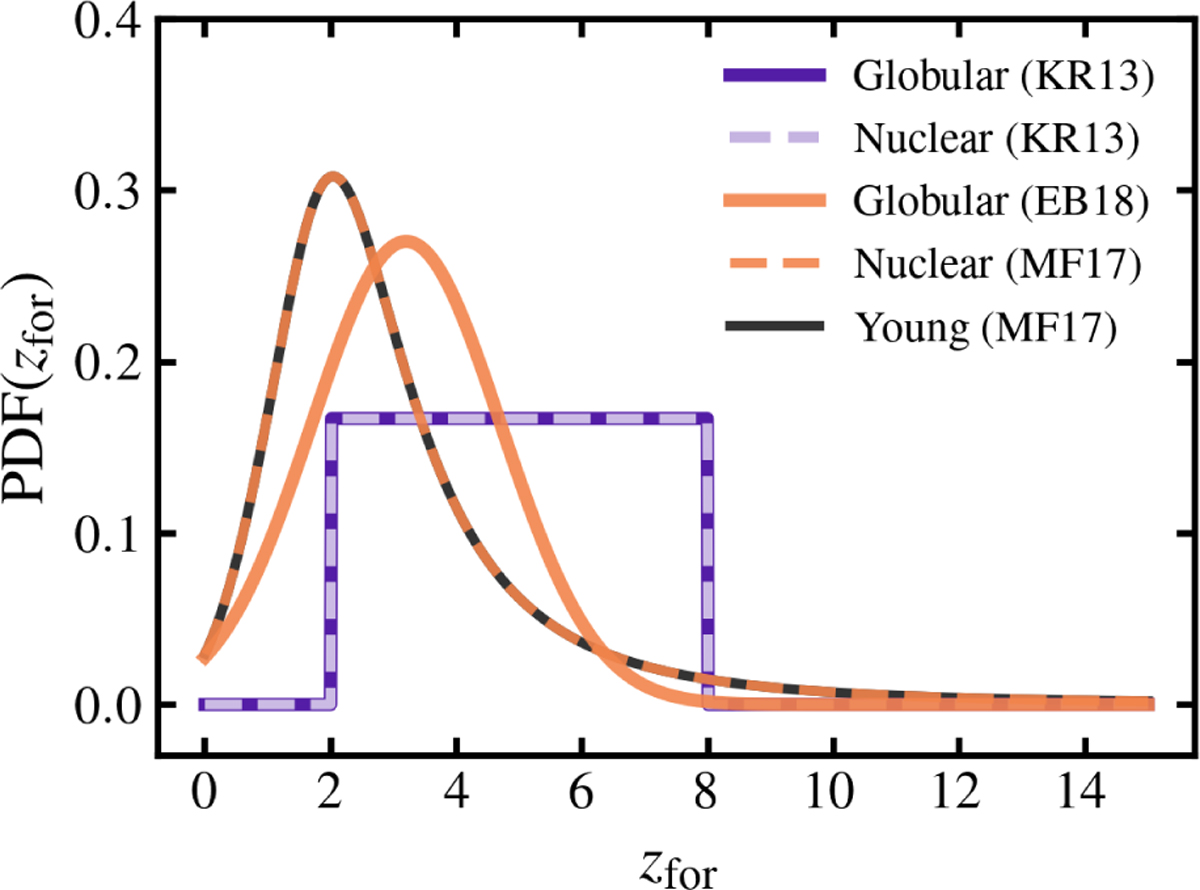
Initial distribution of cluster formation redshifts. The different colors refer to different assumptions on the initial formation histories of GCs (solid lines) and NSCs (dashed lines). The initial redshift distribution of YCs is fixed in all models (gray solid line). The distributions are scaled such that the area subtended by the curve is 1.
Current usage metrics show cumulative count of Article Views (full-text article views including HTML views, PDF and ePub downloads, according to the available data) and Abstracts Views on Vision4Press platform.
Data correspond to usage on the plateform after 2015. The current usage metrics is available 48-96 hours after online publication and is updated daily on week days.
Initial download of the metrics may take a while.