Fig. 2
Download original image
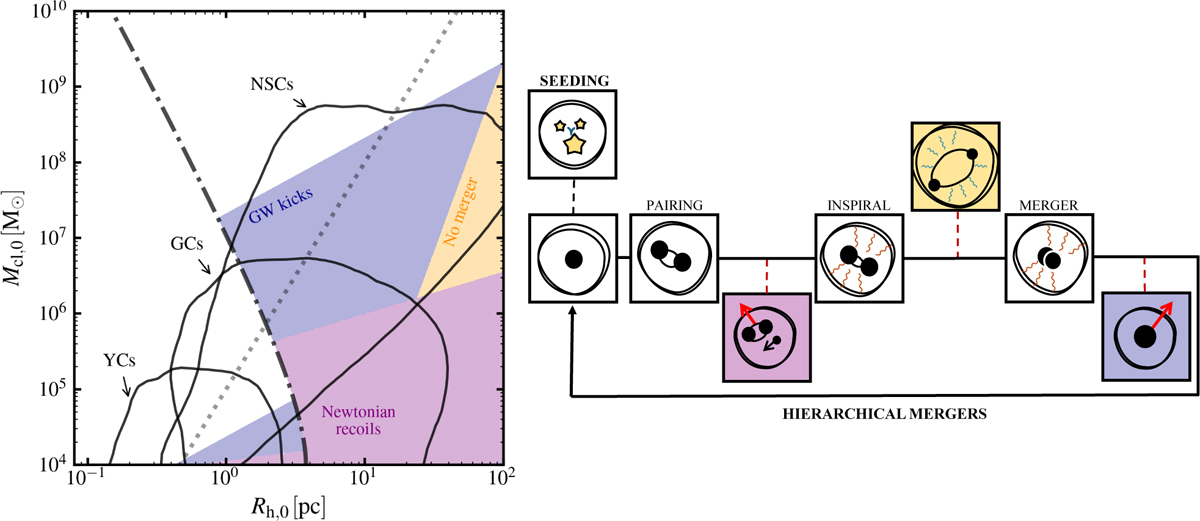
Left panel: initial cluster mass and half-mass radius for YCs (bottom left area), GCs (central area), and NSCs (upper right area). The cluster distributions are cut at the 99% contour. Clusters with tcc < 5 Myr lie below the dot-dashed black line; those with central density ρcl,0 > 105 M⊙ pc−3 are above the shaded dotted gray line. We also identify regions of the parameter space in which (i) a BBH binary is ejected before merging due to strong Newtonian recoils (in pink), (ii) the merger remnant is typically kicked out of the cluster due to its relativistic kick (in purple), (iii) the BBH merger time exceeds a Hubble time (in yellow). Right panel: schematic overview of a BH dynamical growth in a star cluster. The colored boxes refer to the regions highlighted in the left plot.
Current usage metrics show cumulative count of Article Views (full-text article views including HTML views, PDF and ePub downloads, according to the available data) and Abstracts Views on Vision4Press platform.
Data correspond to usage on the plateform after 2015. The current usage metrics is available 48-96 hours after online publication and is updated daily on week days.
Initial download of the metrics may take a while.