Fig. 4
Download original image
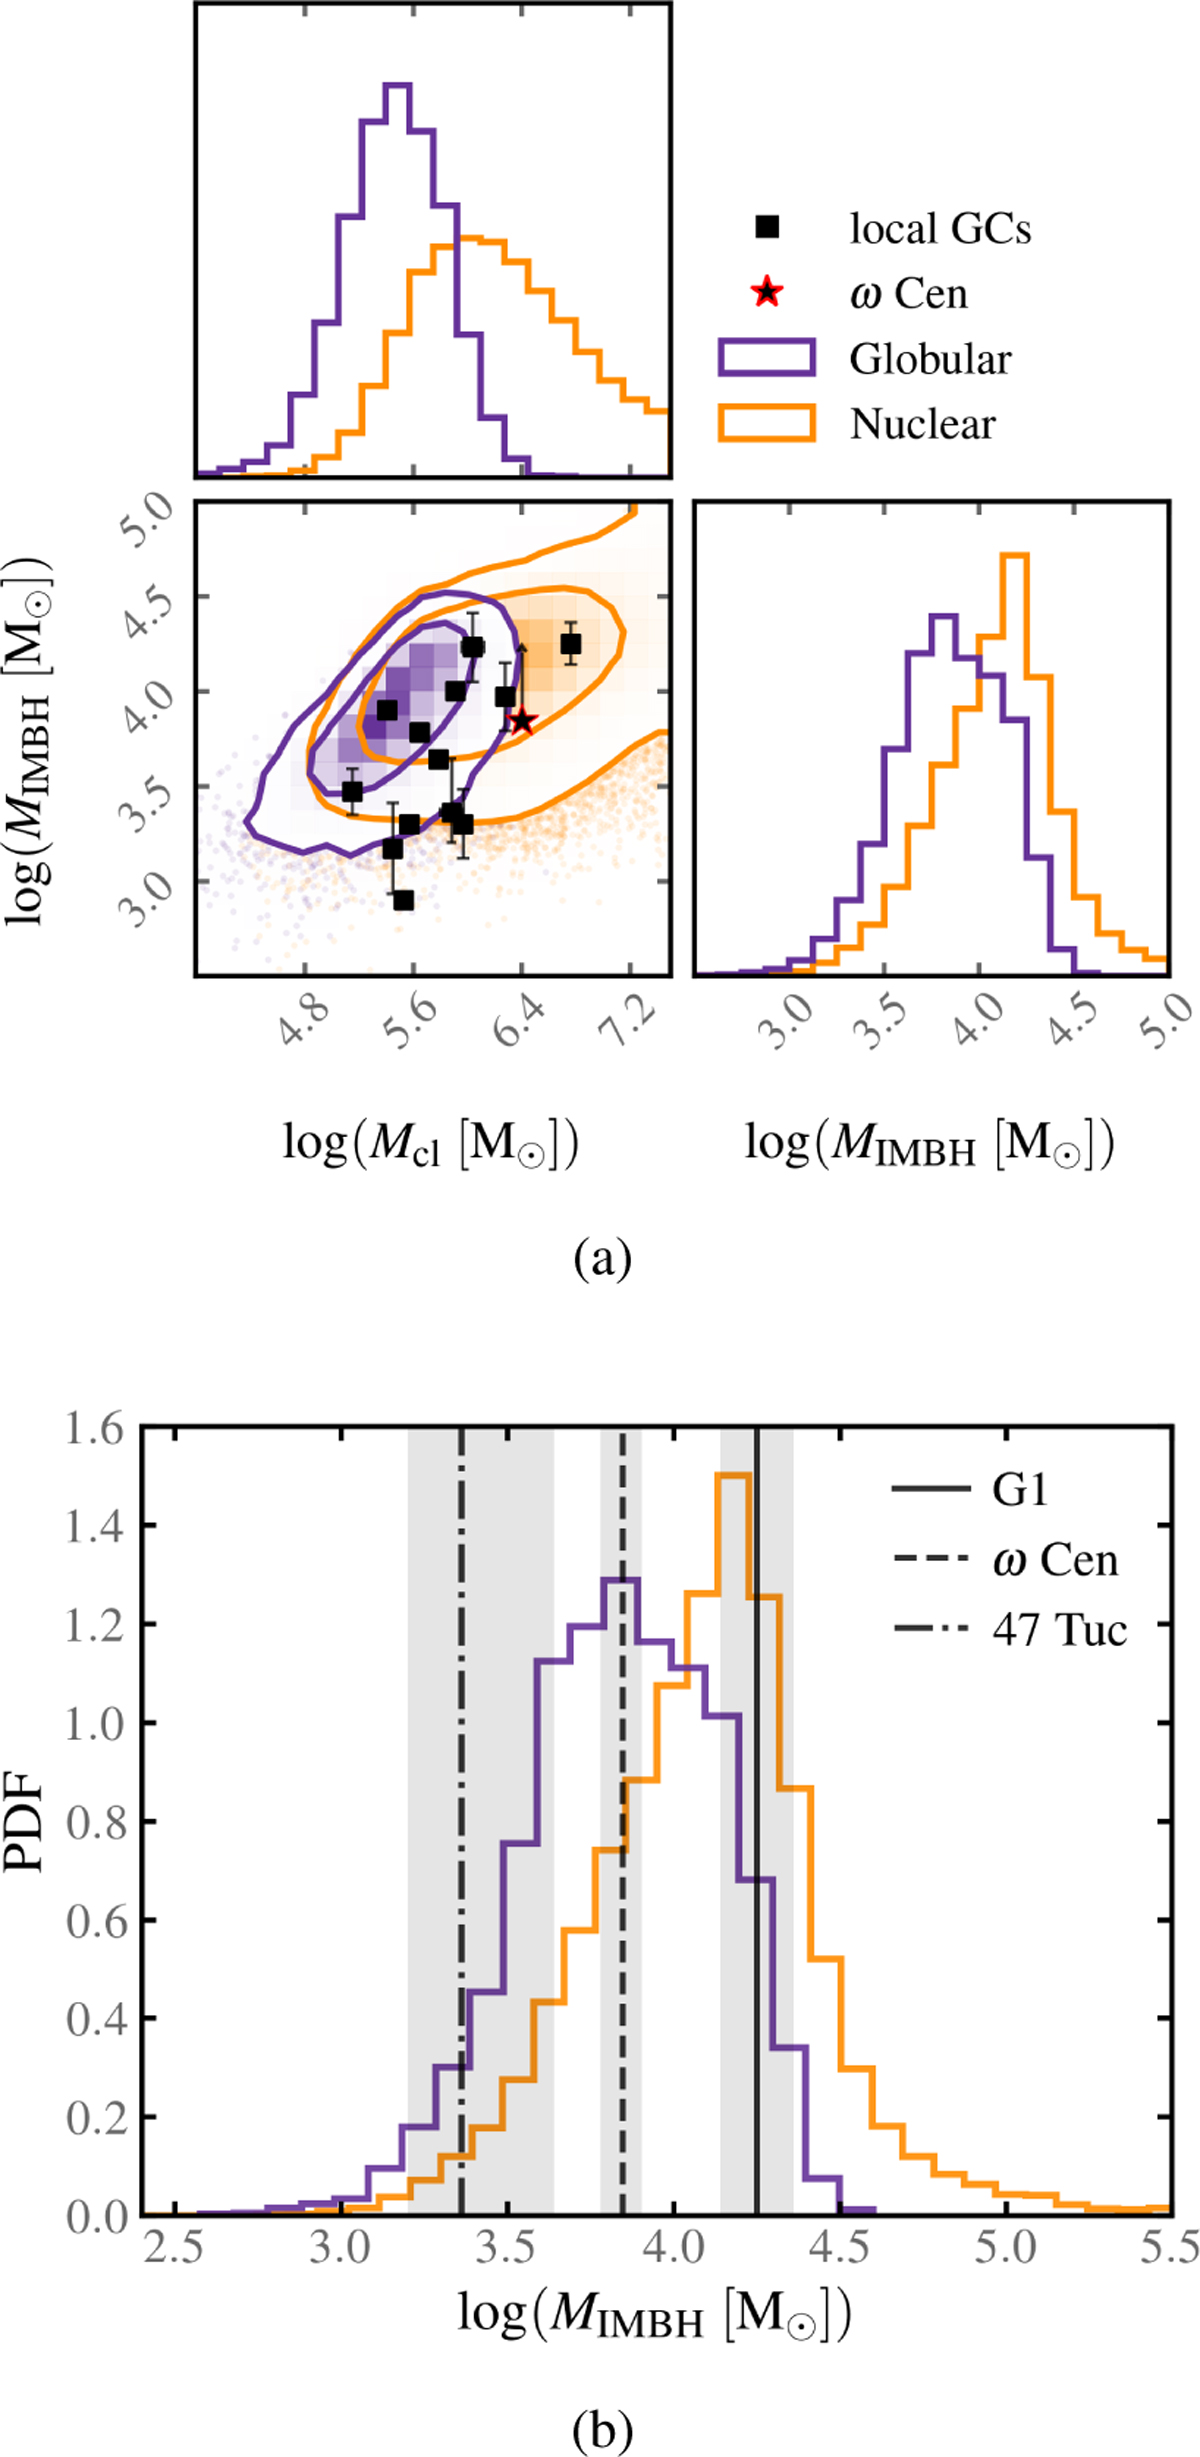
Comparison of simulated IMBH candidates in Model B with observational data. (a) Corner plot showing the GCs (purple) and NSCs (orange) clusters in our simulations hosting an IMBH at z = 0, compared to observations of potential IMBHs in Milky Way globular clusters and G1. (b) One-dimensional IMBH mass distribution, compared to estimated masses for G1 and 47 Tuc.
Current usage metrics show cumulative count of Article Views (full-text article views including HTML views, PDF and ePub downloads, according to the available data) and Abstracts Views on Vision4Press platform.
Data correspond to usage on the plateform after 2015. The current usage metrics is available 48-96 hours after online publication and is updated daily on week days.
Initial download of the metrics may take a while.