Fig. C.1
Download original image
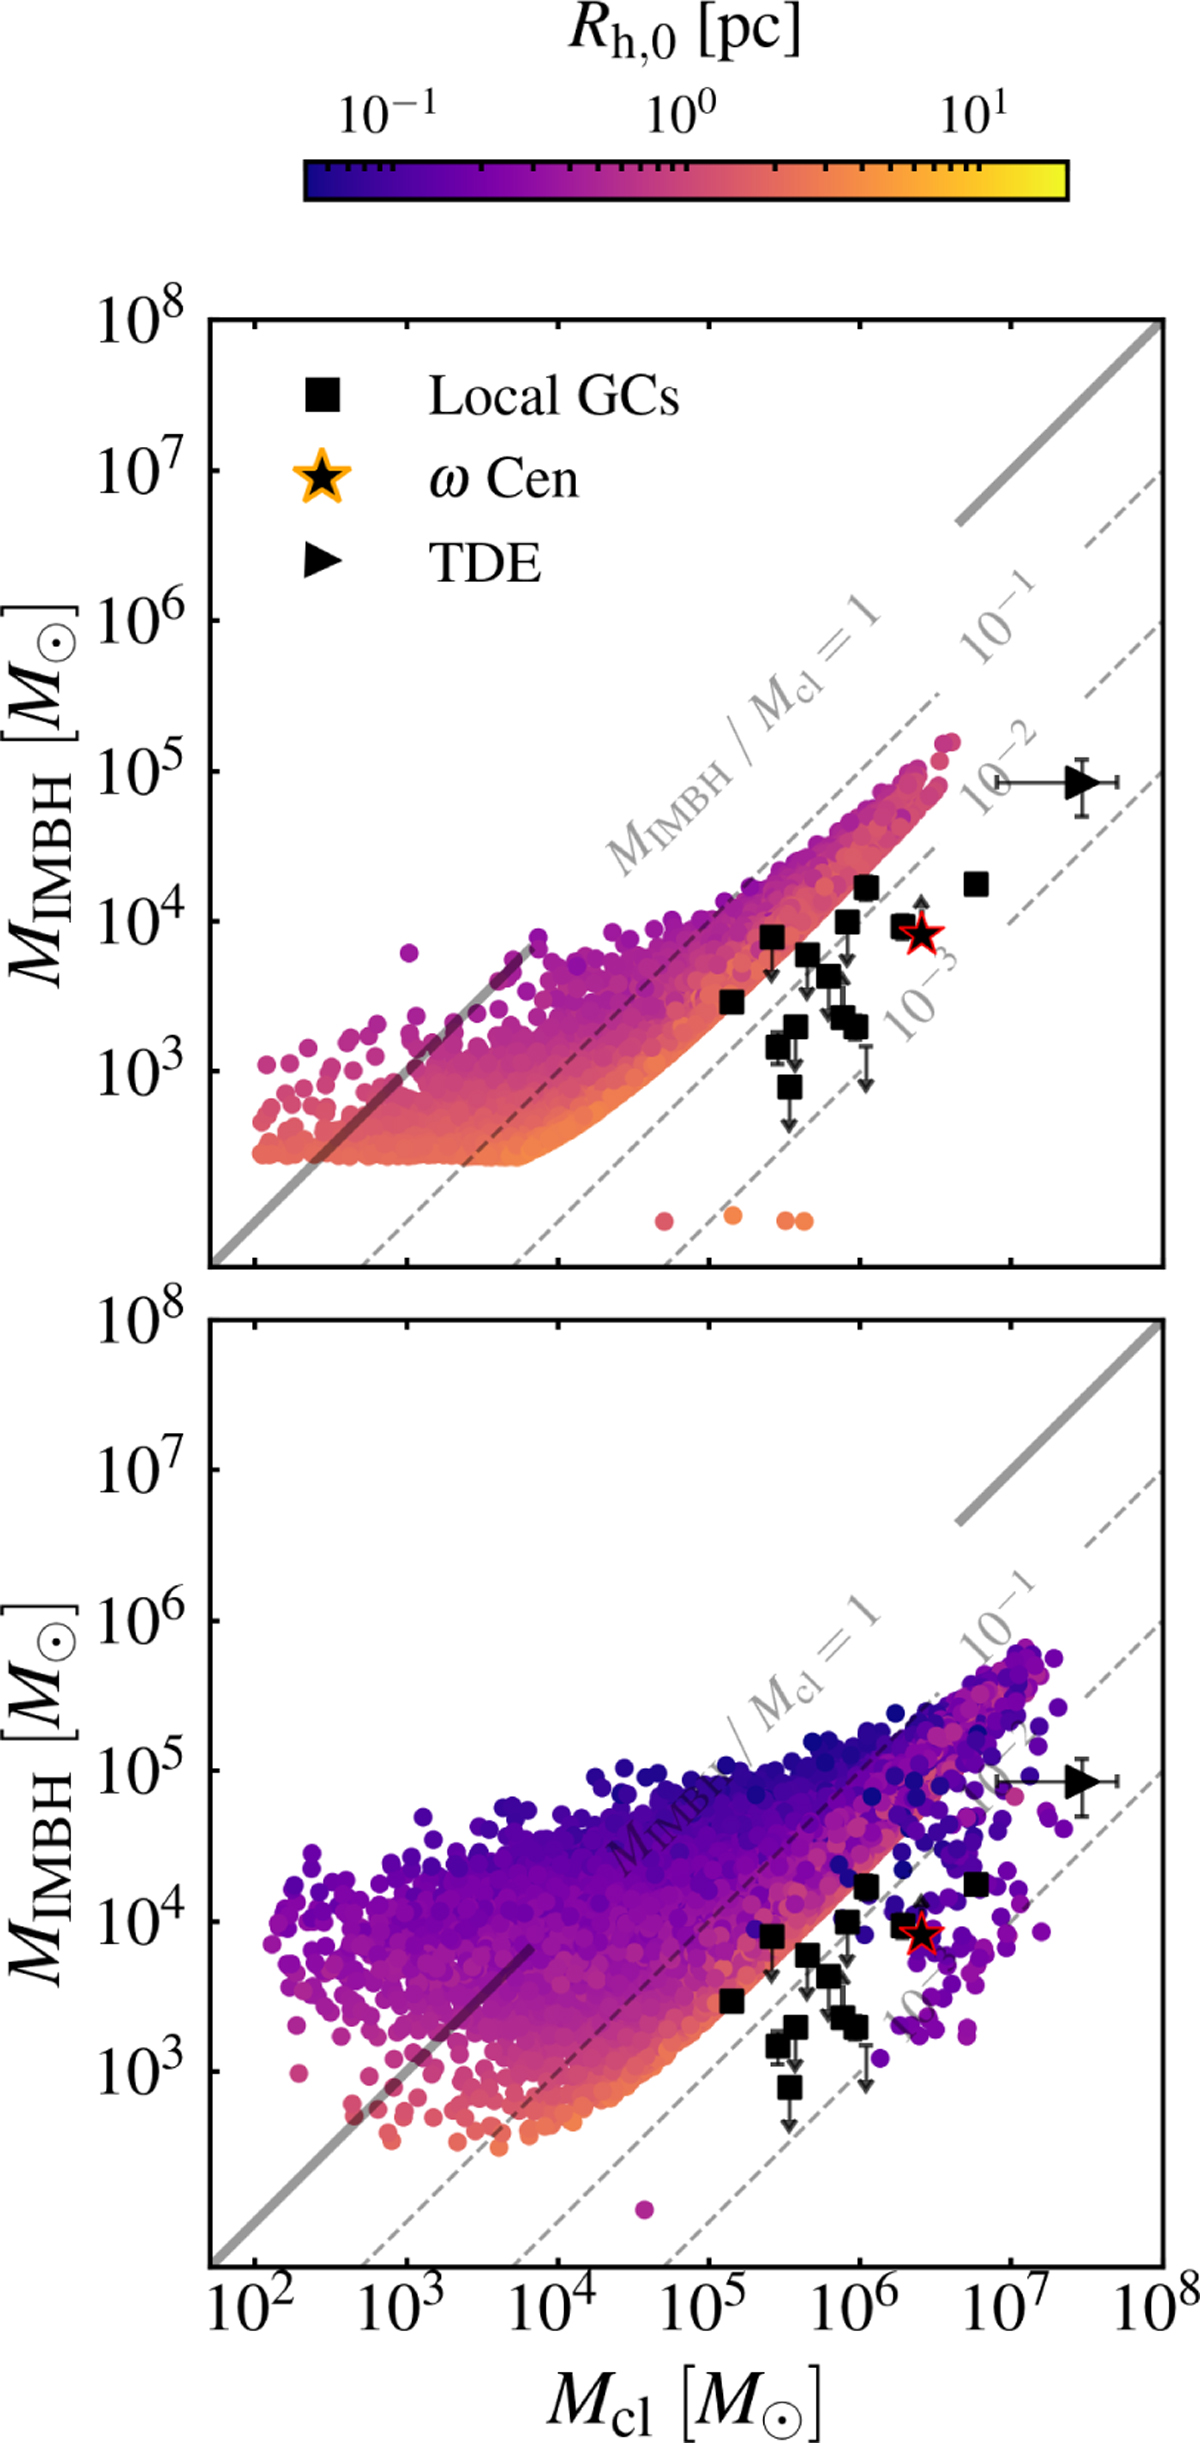
GCs hosting an IMBH at z = 0, compared to observed host candidates in local GCs (squares; Lützgendorf et al. 2013b) and a potential TDE (right triangle; Lin et al. 2018), for two sets of initial mass–half-mass radius conditions. The orange-edged star marks the ω Cen cluster (Häberle et al. 2024). As in Fig. 3, the dashed lines correspond to mass ratios MIMBH/Mcl = 10−1, 10−2, 10−3. The top panel shows the results from a B-POP simulation of 108 GCs, while the bottom panel shows the results from a simulation in which the same GCs have initial masses higher by 0.5 dex and half-mass radii smaller by 1 dex.
Current usage metrics show cumulative count of Article Views (full-text article views including HTML views, PDF and ePub downloads, according to the available data) and Abstracts Views on Vision4Press platform.
Data correspond to usage on the plateform after 2015. The current usage metrics is available 48-96 hours after online publication and is updated daily on week days.
Initial download of the metrics may take a while.