Fig. 3
Download original image
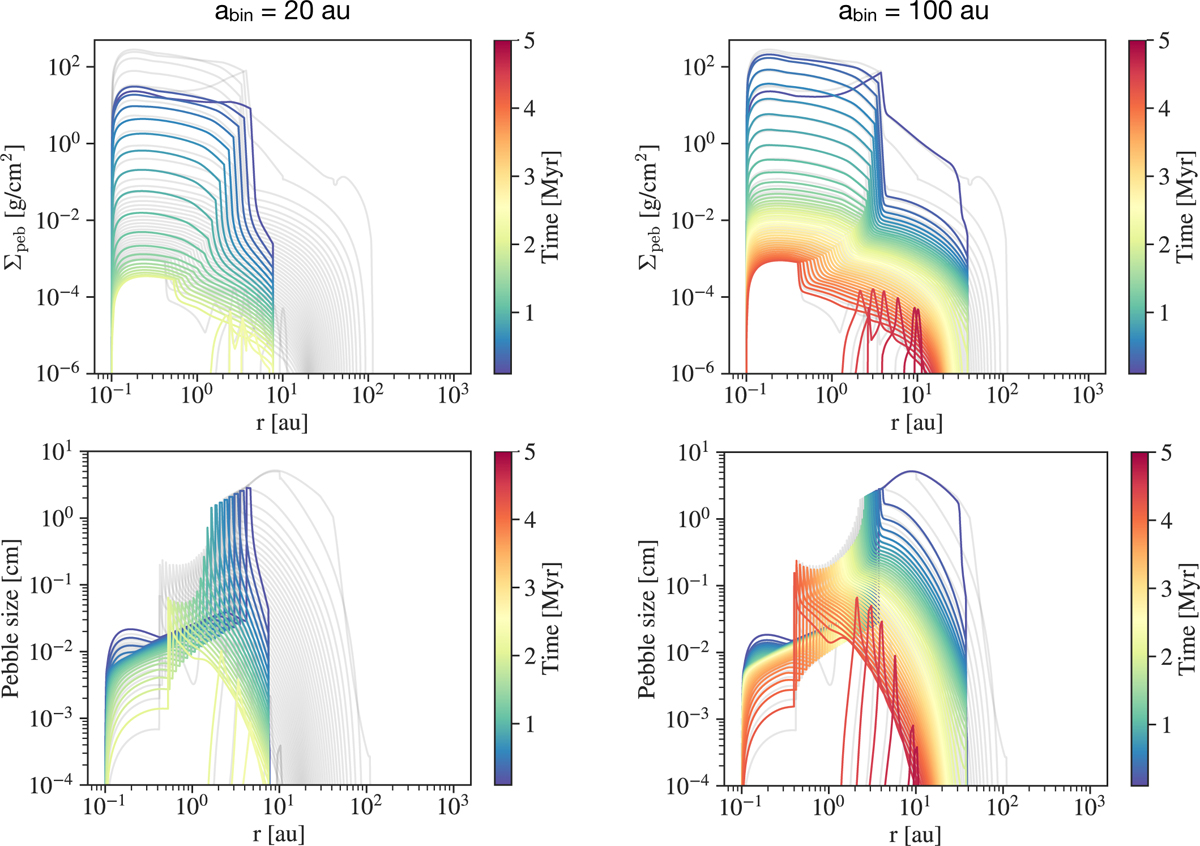
Evolution of the pebble disc as function of orbital distance from the primary for the nominal disc with binary separations of abin = 20 au (left) and abin = 100 au (right). The grey background curves correspond to the single-star case. The disc profiles are shown every 105 years. The top panels indicate the evolution of the pebble surface density, and the bottom panels show the evolution of the pebble sizes. The abrupt change in the pebble size at r ~ 0.4–5 au for all the profiles and times corresponds to the location of the water-ice line. This also affects the profiles of the pebble surface density.
Current usage metrics show cumulative count of Article Views (full-text article views including HTML views, PDF and ePub downloads, according to the available data) and Abstracts Views on Vision4Press platform.
Data correspond to usage on the plateform after 2015. The current usage metrics is available 48-96 hours after online publication and is updated daily on week days.
Initial download of the metrics may take a while.