Fig. 4
Download original image
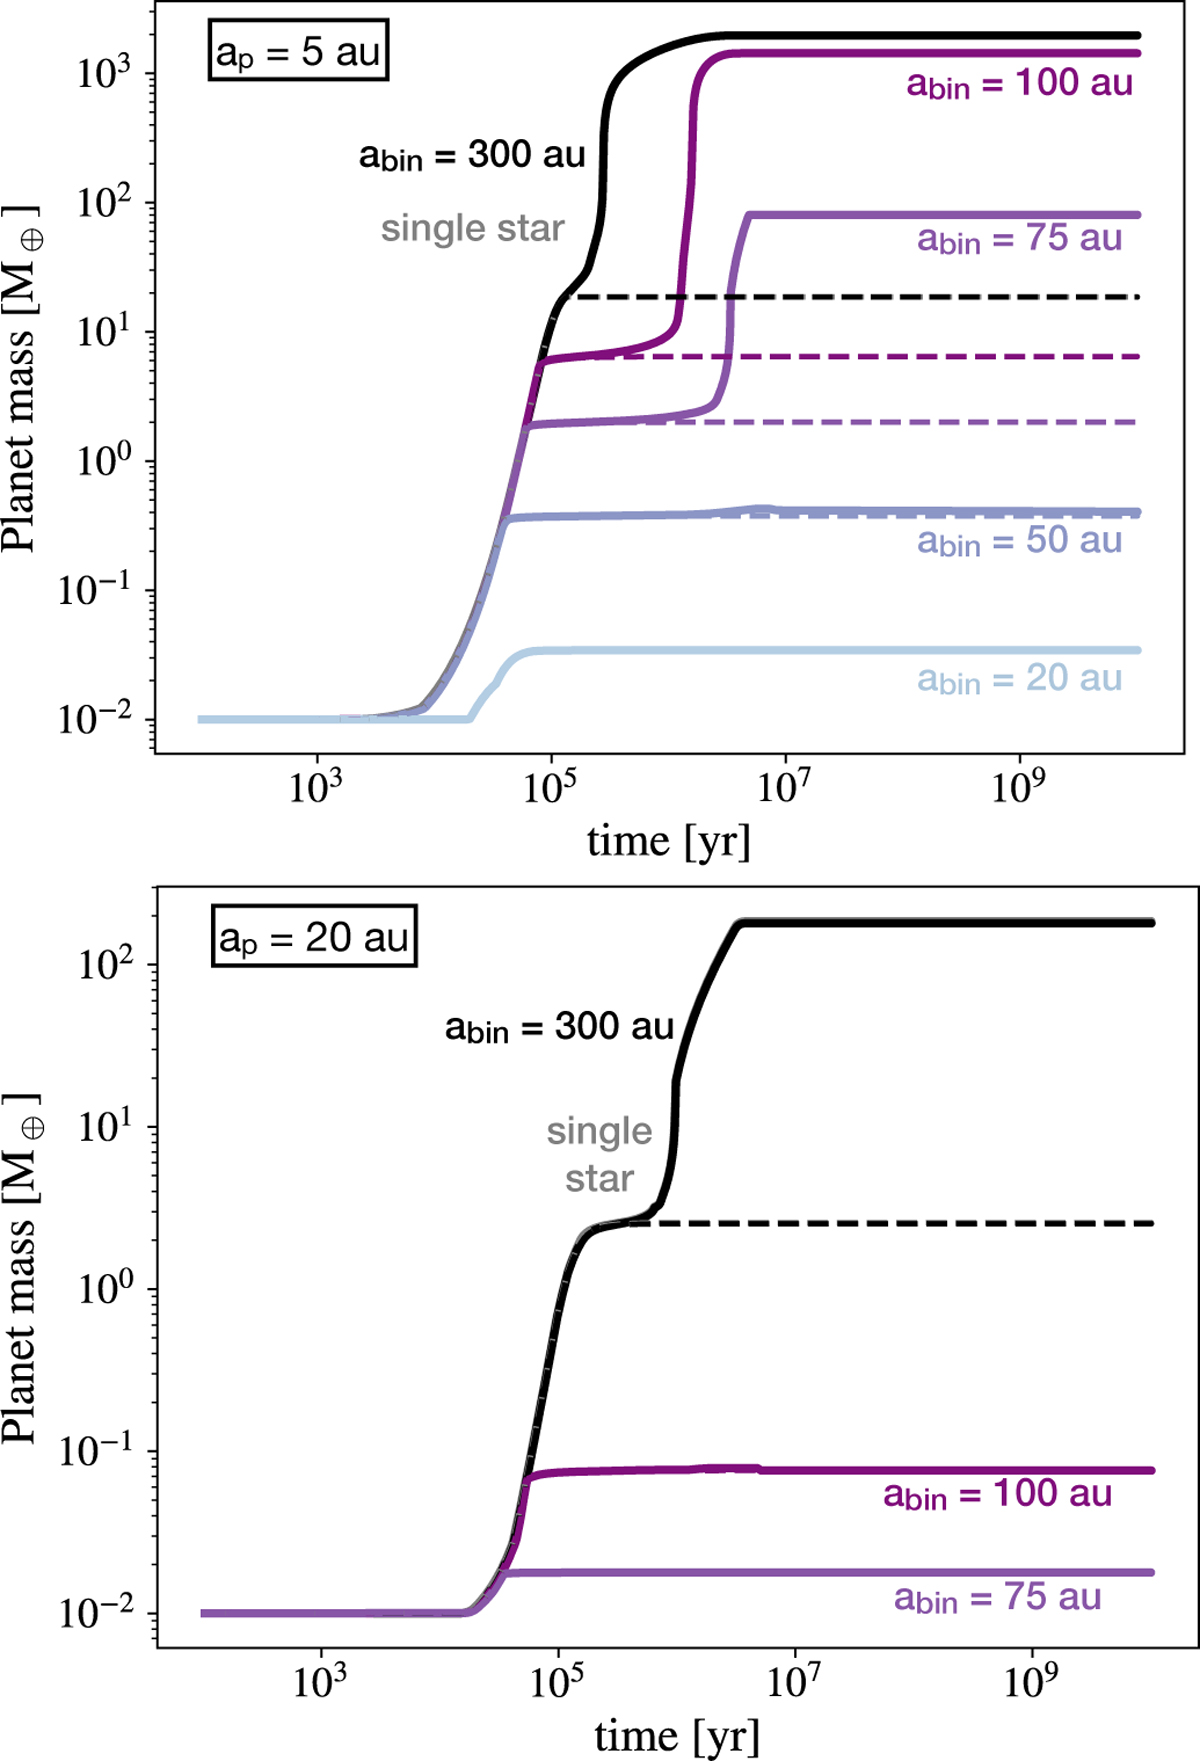
In situ planet growth by pebble accretion at ap = 5 au (top panel) and ap = 20 au (bottom panel). The solid lines indicate the evolution of the total planet mass, and the dashed lines show the evolution of the core mass. The different colours correspond to different binary separations, as indicated in the labels. After the final planet mass is reached during the disc lifetime (a few million years), the planet evolves during gigayears by cooling and contraction.
Current usage metrics show cumulative count of Article Views (full-text article views including HTML views, PDF and ePub downloads, according to the available data) and Abstracts Views on Vision4Press platform.
Data correspond to usage on the plateform after 2015. The current usage metrics is available 48-96 hours after online publication and is updated daily on week days.
Initial download of the metrics may take a while.