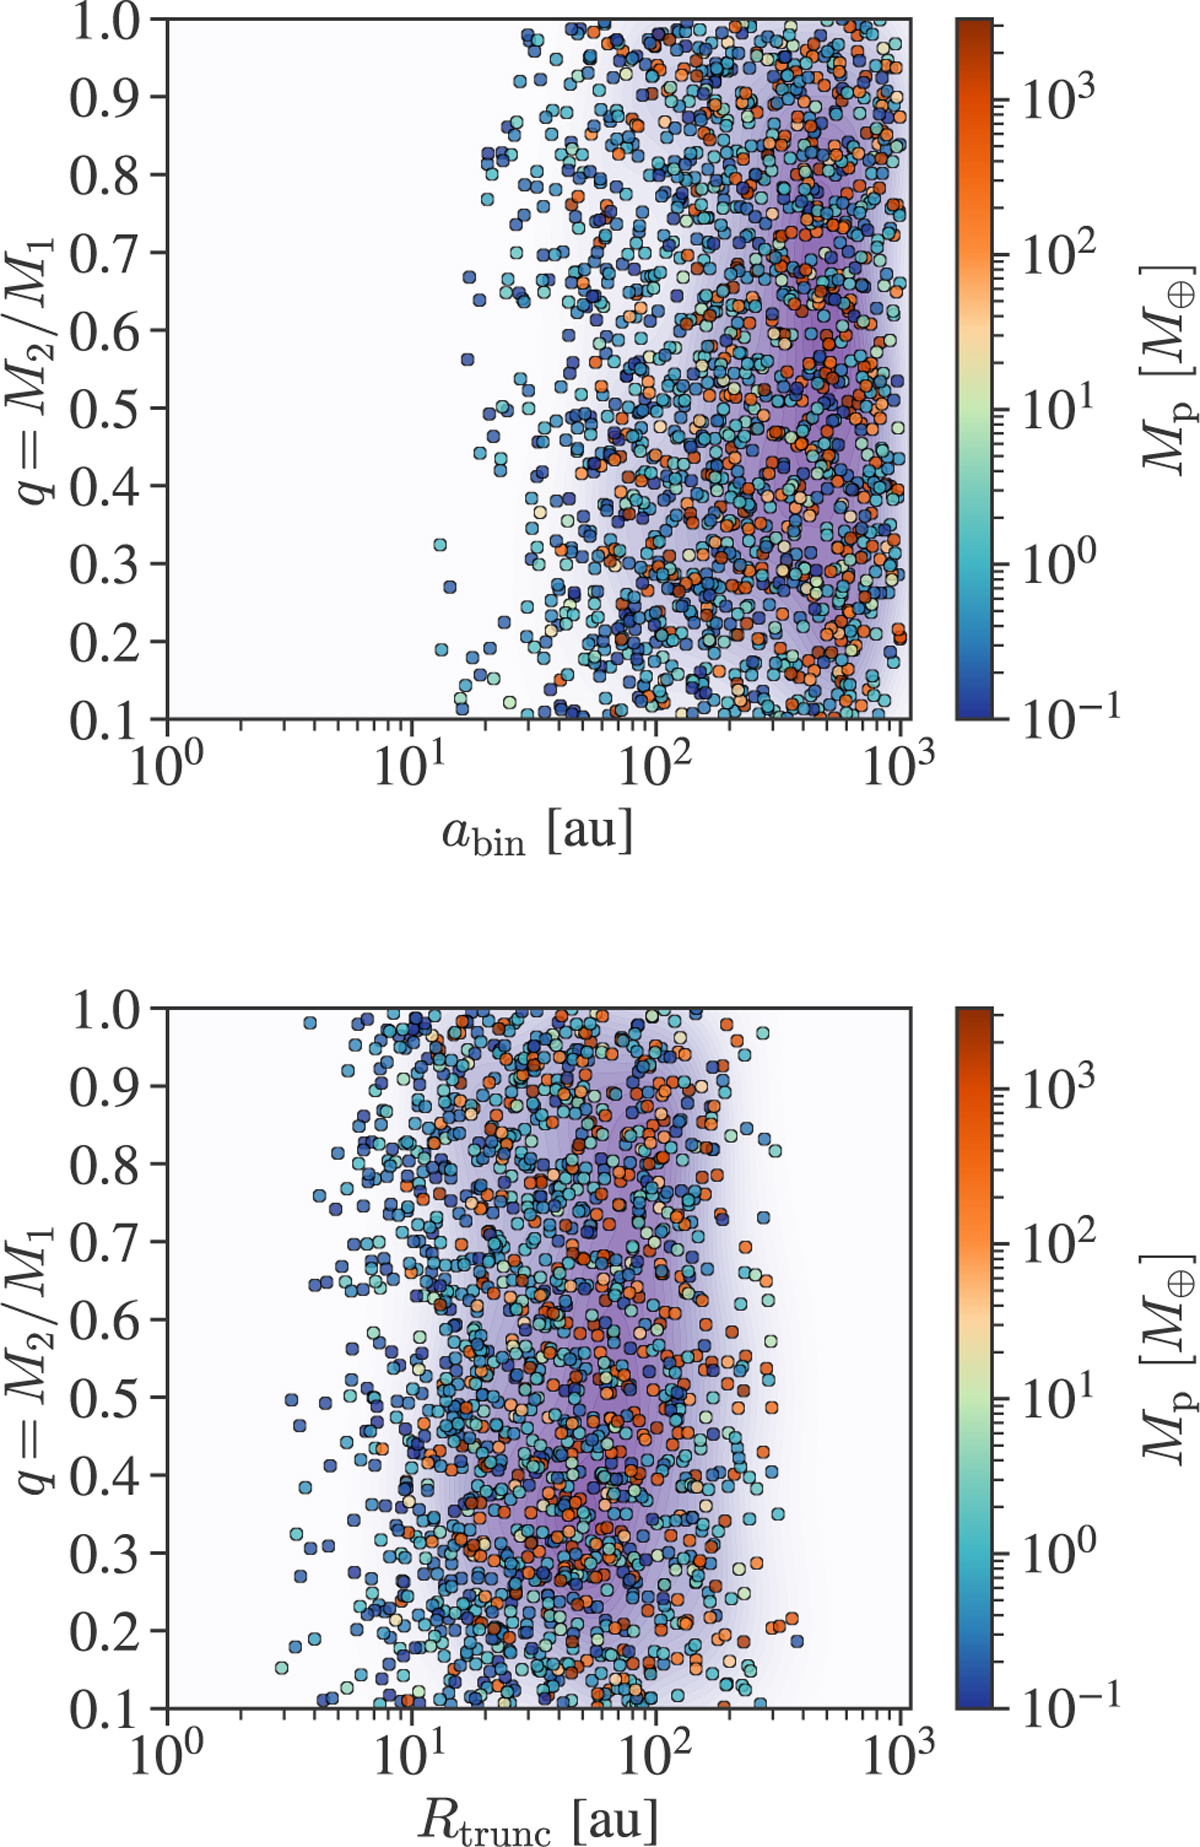
Fig. 5
Download original image
Binary mass ratio vs. binary separation (top panel) and binary mass ratio vs. disc truncation radius (bottom panel) for systems that formed a planet at least more massive than Mars. The colour bar indicates the final planet mass. The shaded contour regions represent areas with the highest number planet density, derived from a two-dimensional KDE performed on planets with masses greater than 10 M⊕. The lack of planets for Rtrunc>400 au stems from the choice of the upper limit on abin = 1000 au (see Table 1).
Current usage metrics show cumulative count of Article Views (full-text article views including HTML views, PDF and ePub downloads, according to the available data) and Abstracts Views on Vision4Press platform.
Data correspond to usage on the plateform after 2015. The current usage metrics is available 48-96 hours after online publication and is updated daily on week days.
Initial download of the metrics may take a while.