Fig. 6
Download original image
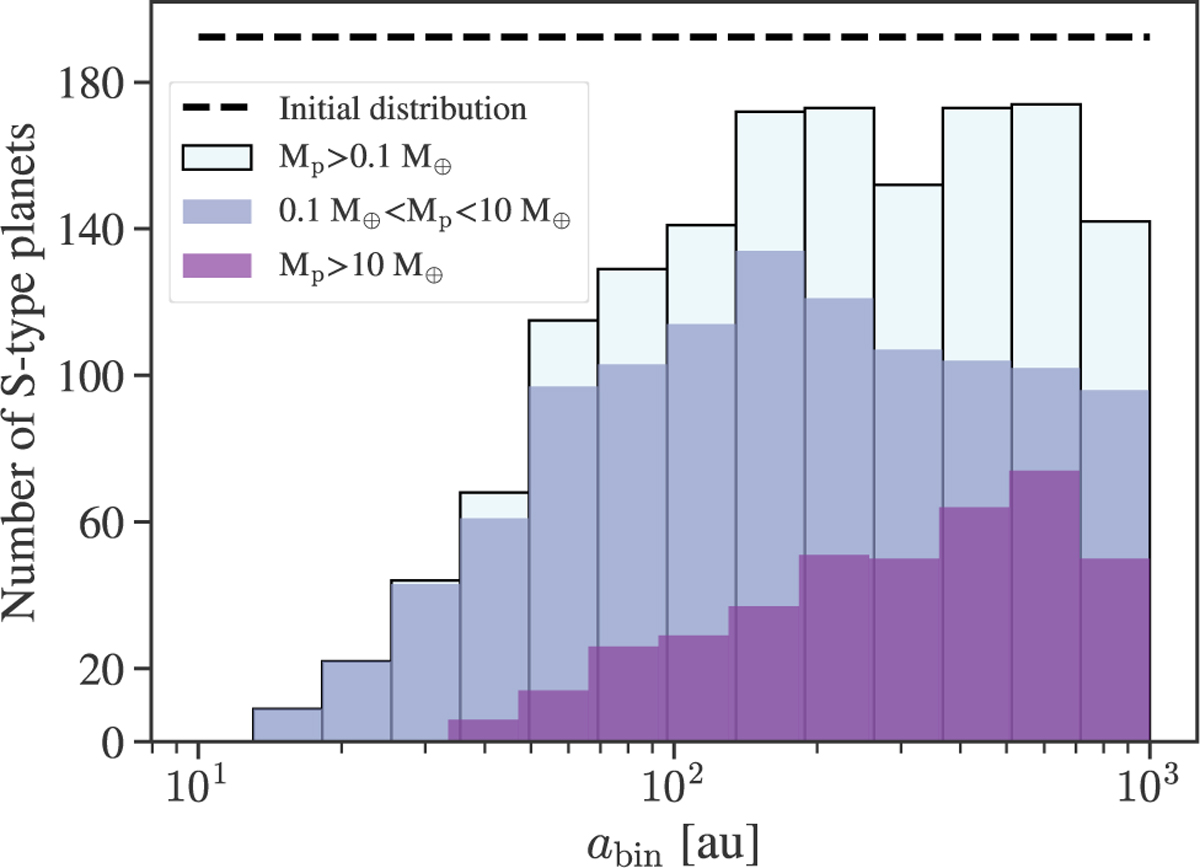
Number of formed S-type planets as a function of binary semi-major axis (abin) from the grid of 5000 simulations presented in Sect. 3.4. The dashed black line illustrates the log-uniform distribution of abin adopted as the initial condition (multiplied by 0.5 for better visualisation). The different colours of the bars correspond to different ranges of planet mass, indicated in the legend of the figure. The simulations assumed one embryo per disc and did not include the gravitational perturbation from the secondary or orbital migration.
Current usage metrics show cumulative count of Article Views (full-text article views including HTML views, PDF and ePub downloads, according to the available data) and Abstracts Views on Vision4Press platform.
Data correspond to usage on the plateform after 2015. The current usage metrics is available 48-96 hours after online publication and is updated daily on week days.
Initial download of the metrics may take a while.