Fig. 1.
Download original image
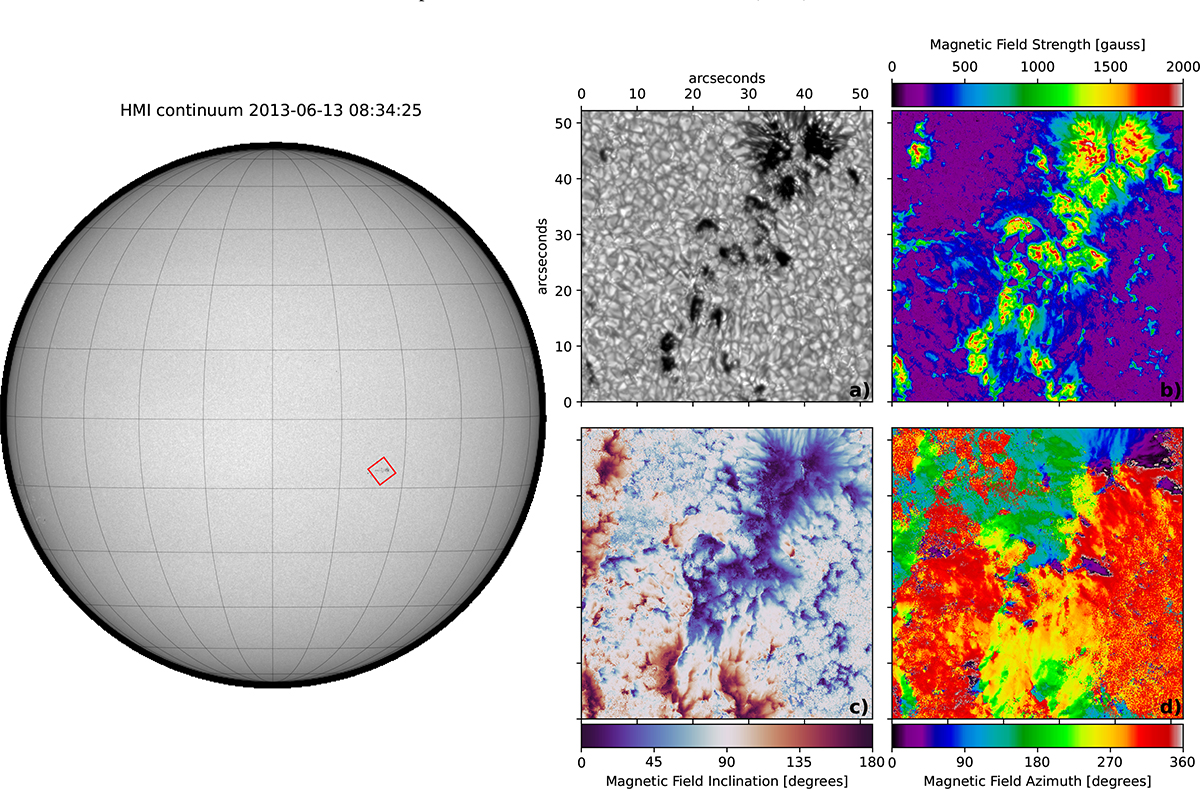
Left: Full-disk image context from the Helioseismic and Magnetic Imager (HMI) on board the Solar Dynamics Observatory (SDO). The red rectangle shows the region of interest observed by the 1-m SST. Right: Four-image grid displaying maps obtained from the SST data, including (a) blue-continuum intensity image, (b) strength of the magnetic field, (c) magnetic field inclination, and (d) magnetic field azimuth.
Current usage metrics show cumulative count of Article Views (full-text article views including HTML views, PDF and ePub downloads, according to the available data) and Abstracts Views on Vision4Press platform.
Data correspond to usage on the plateform after 2015. The current usage metrics is available 48-96 hours after online publication and is updated daily on week days.
Initial download of the metrics may take a while.