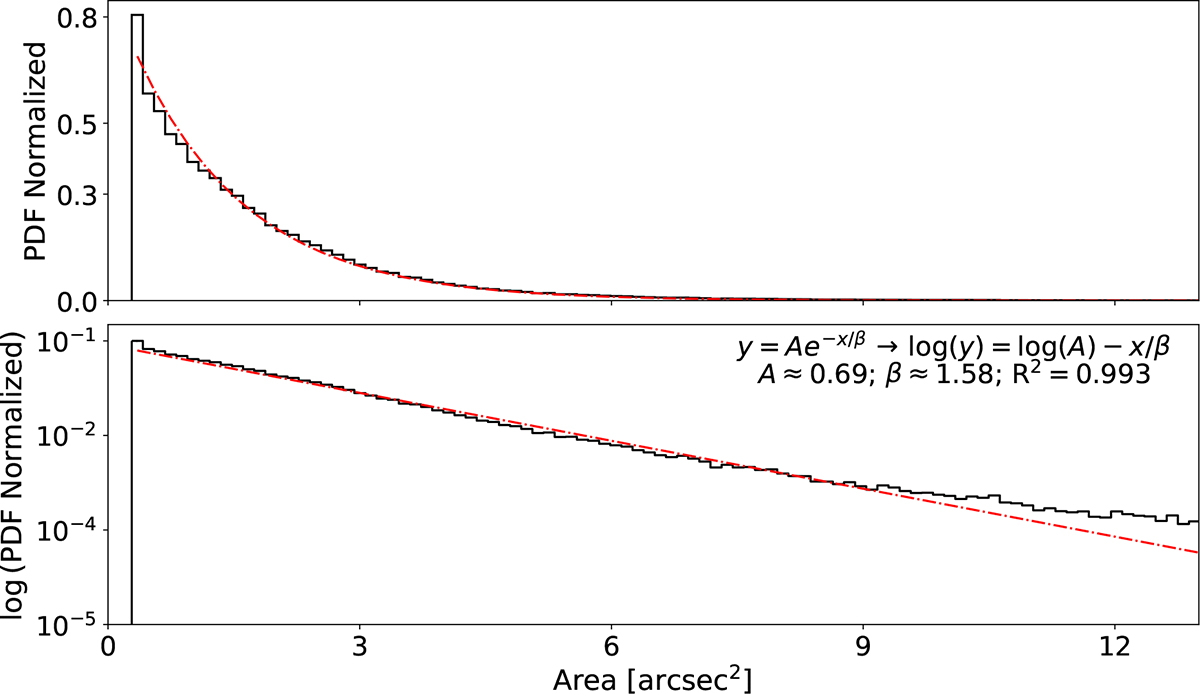
Fig. 3.
Download original image
Granule area distributions. Top panel: Raw distribution of granule areas including outliers, with a fixed bin width of ∼0.15 arcsec2. Bottom panel: Histogram log(PDF) vs area, where the PDF is the normalised probability density of the area distribution. The dashed red line represents the fitting of the distribution to the derived parameters.
Current usage metrics show cumulative count of Article Views (full-text article views including HTML views, PDF and ePub downloads, according to the available data) and Abstracts Views on Vision4Press platform.
Data correspond to usage on the plateform after 2015. The current usage metrics is available 48-96 hours after online publication and is updated daily on week days.
Initial download of the metrics may take a while.