Fig. 4.
Download original image
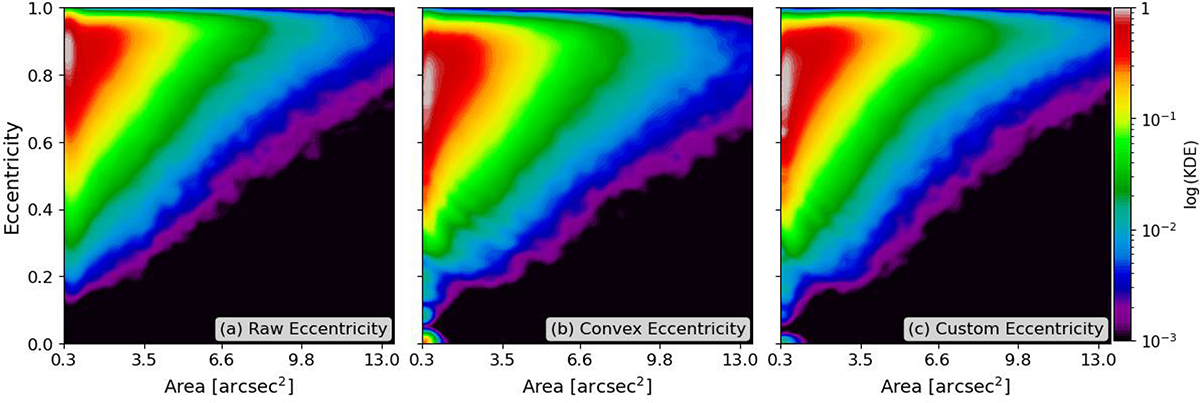
2D-log(KDE) plots showing the distribution of the areas and the three eccentricity metrics: (a) raw eccentricity (ellipse fitting), (b) convex eccentricity (computed on convex hulls), and (c) custom eccentricity (based on extreme points through the centre of mass of the segments). Each plot highlights the most probable eccentricity-area combinations and reveals trends.
Current usage metrics show cumulative count of Article Views (full-text article views including HTML views, PDF and ePub downloads, according to the available data) and Abstracts Views on Vision4Press platform.
Data correspond to usage on the plateform after 2015. The current usage metrics is available 48-96 hours after online publication and is updated daily on week days.
Initial download of the metrics may take a while.