Open Access
Fig. 8.
Download original image
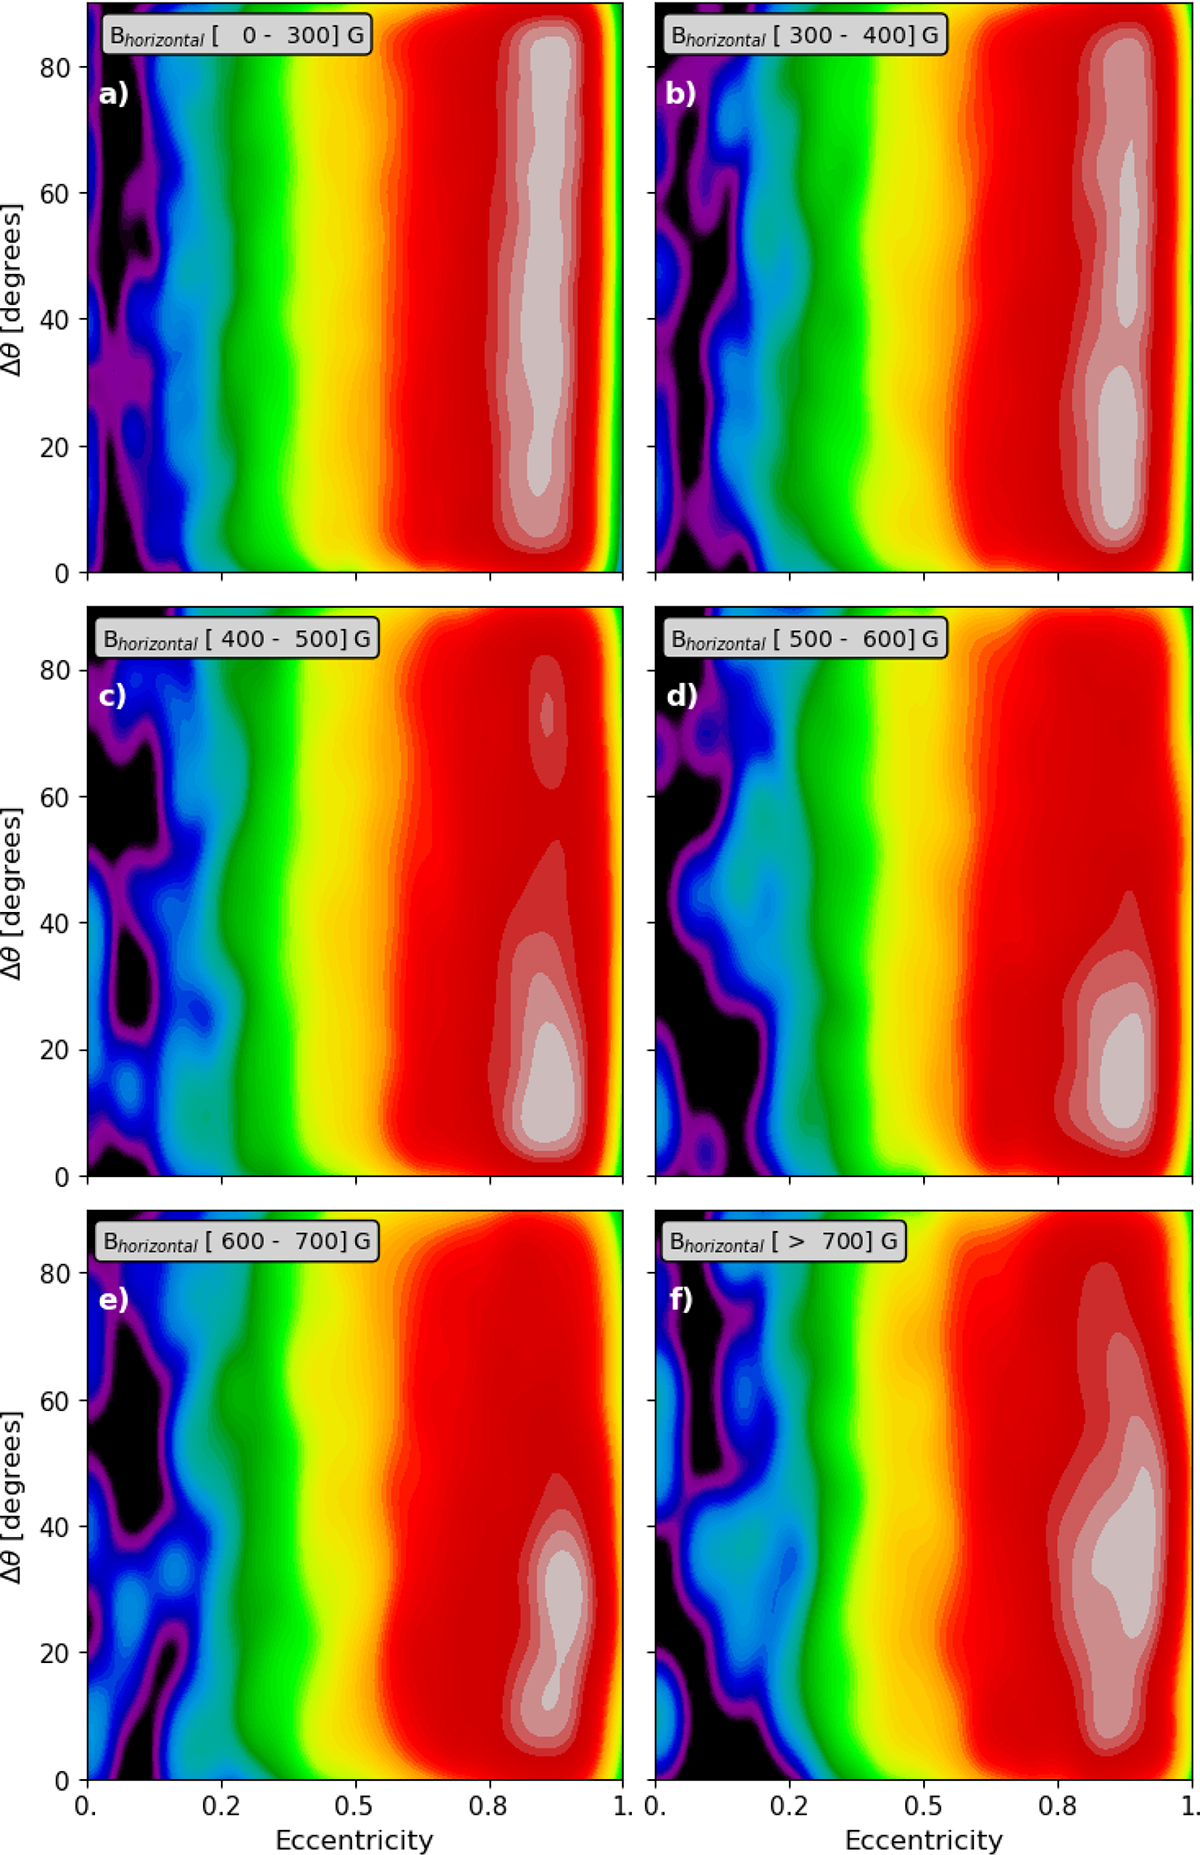
2D-KDE plots showing the relationship between granule area and Δθ, as influenced by the horizontal magnetic field. Panel (a) covers 0–300 G. Panels (b)-(f) illustrate how the area–Δθ relationship evolves across different horizontal magnetic field ranges. The colour-coding follows that in Fig. 4.
Current usage metrics show cumulative count of Article Views (full-text article views including HTML views, PDF and ePub downloads, according to the available data) and Abstracts Views on Vision4Press platform.
Data correspond to usage on the plateform after 2015. The current usage metrics is available 48-96 hours after online publication and is updated daily on week days.
Initial download of the metrics may take a while.