Fig. 14.
Download original image
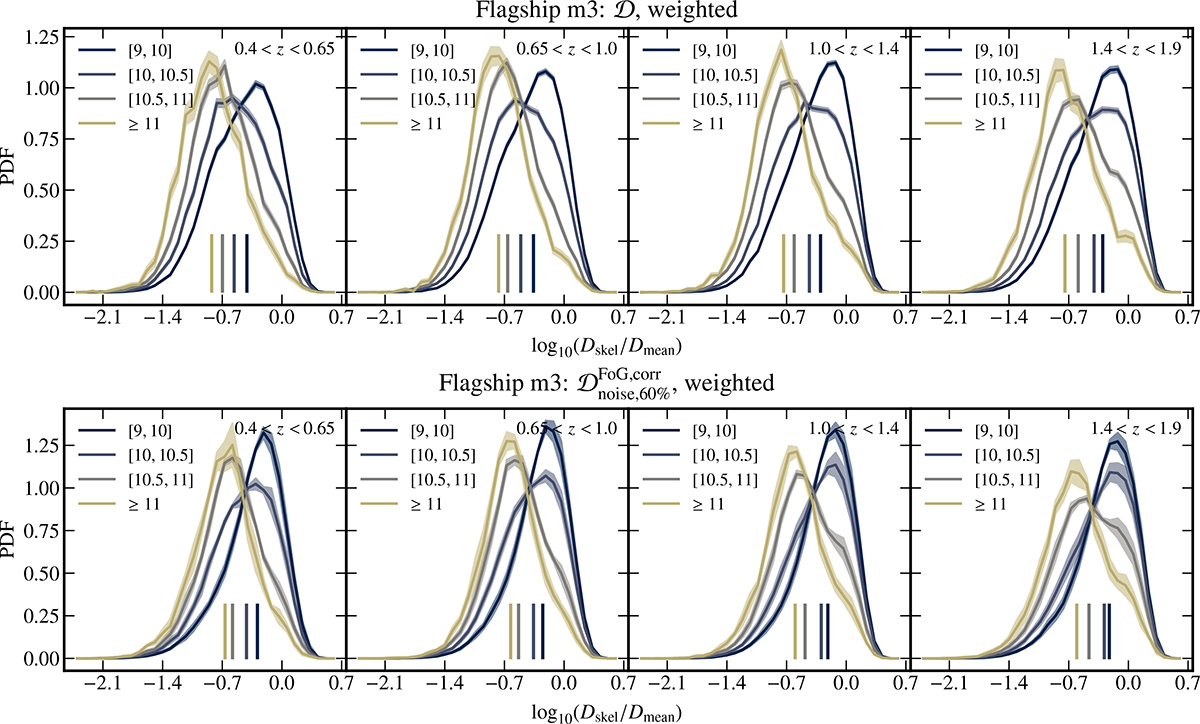
PDFs of the closest filament’s distance, normalised by the redshift dependent mean intergalactic separation, for galaxies in the Flagship mock (model m3) in different stellar mass bins (coloured lines; with numbers indicating log10(M*/M⊙) values) and the cosmic web reconstructed using the stellar mass-weighted Delaunay tessellation. Stellar-mass gradients are shown as a function of redshift from the lowest redshift bin (left) to the highest one (right). Stellar-mass gradients, with more massive galaxies located closer to the filaments than their lower mass counterparts, present in the reference Hα flux-limited sample (𝒟; top), are recovered when the FoG correction is performed (![]() ; bottom) for the sample with reduced completeness and added redshift error. Vertical lines indicate medians, and the shaded regions are the bootstrap errors for the 𝒟 catalogue and the standard deviation across five mocks for the remaining ones.
; bottom) for the sample with reduced completeness and added redshift error. Vertical lines indicate medians, and the shaded regions are the bootstrap errors for the 𝒟 catalogue and the standard deviation across five mocks for the remaining ones.
Current usage metrics show cumulative count of Article Views (full-text article views including HTML views, PDF and ePub downloads, according to the available data) and Abstracts Views on Vision4Press platform.
Data correspond to usage on the plateform after 2015. The current usage metrics is available 48-96 hours after online publication and is updated daily on week days.
Initial download of the metrics may take a while.