Open Access
Fig. B.2.
Download original image
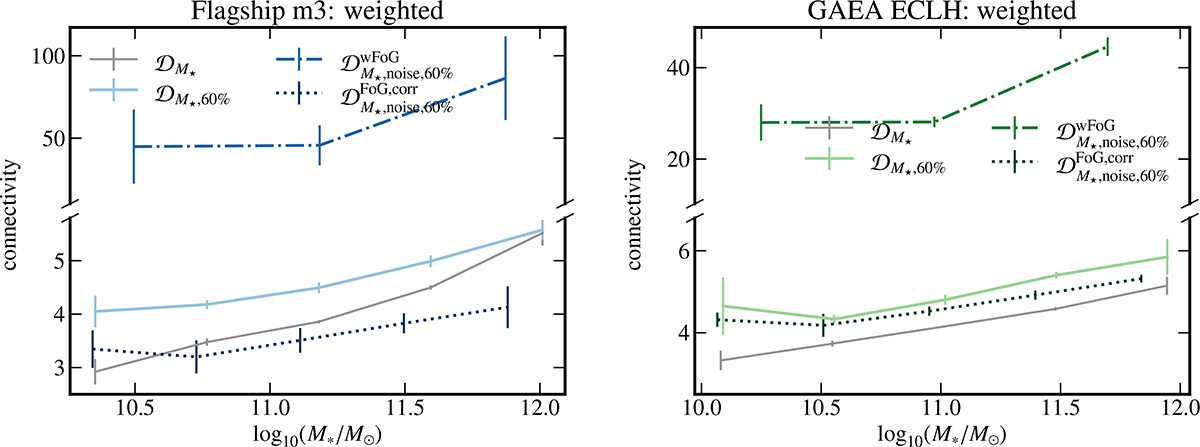
Connectivity of central galaxies as a function of their stellar mass in the Flagship (model m3) and GAEA (model ECLH) mocks, right and left panels, respectively, for M*-limited samples (![]() ), with M*-weighted tessellation (qualitatively similar results are obtained without weighting).
), with M*-weighted tessellation (qualitatively similar results are obtained without weighting).
Current usage metrics show cumulative count of Article Views (full-text article views including HTML views, PDF and ePub downloads, according to the available data) and Abstracts Views on Vision4Press platform.
Data correspond to usage on the plateform after 2015. The current usage metrics is available 48-96 hours after online publication and is updated daily on week days.
Initial download of the metrics may take a while.