Fig. 2.
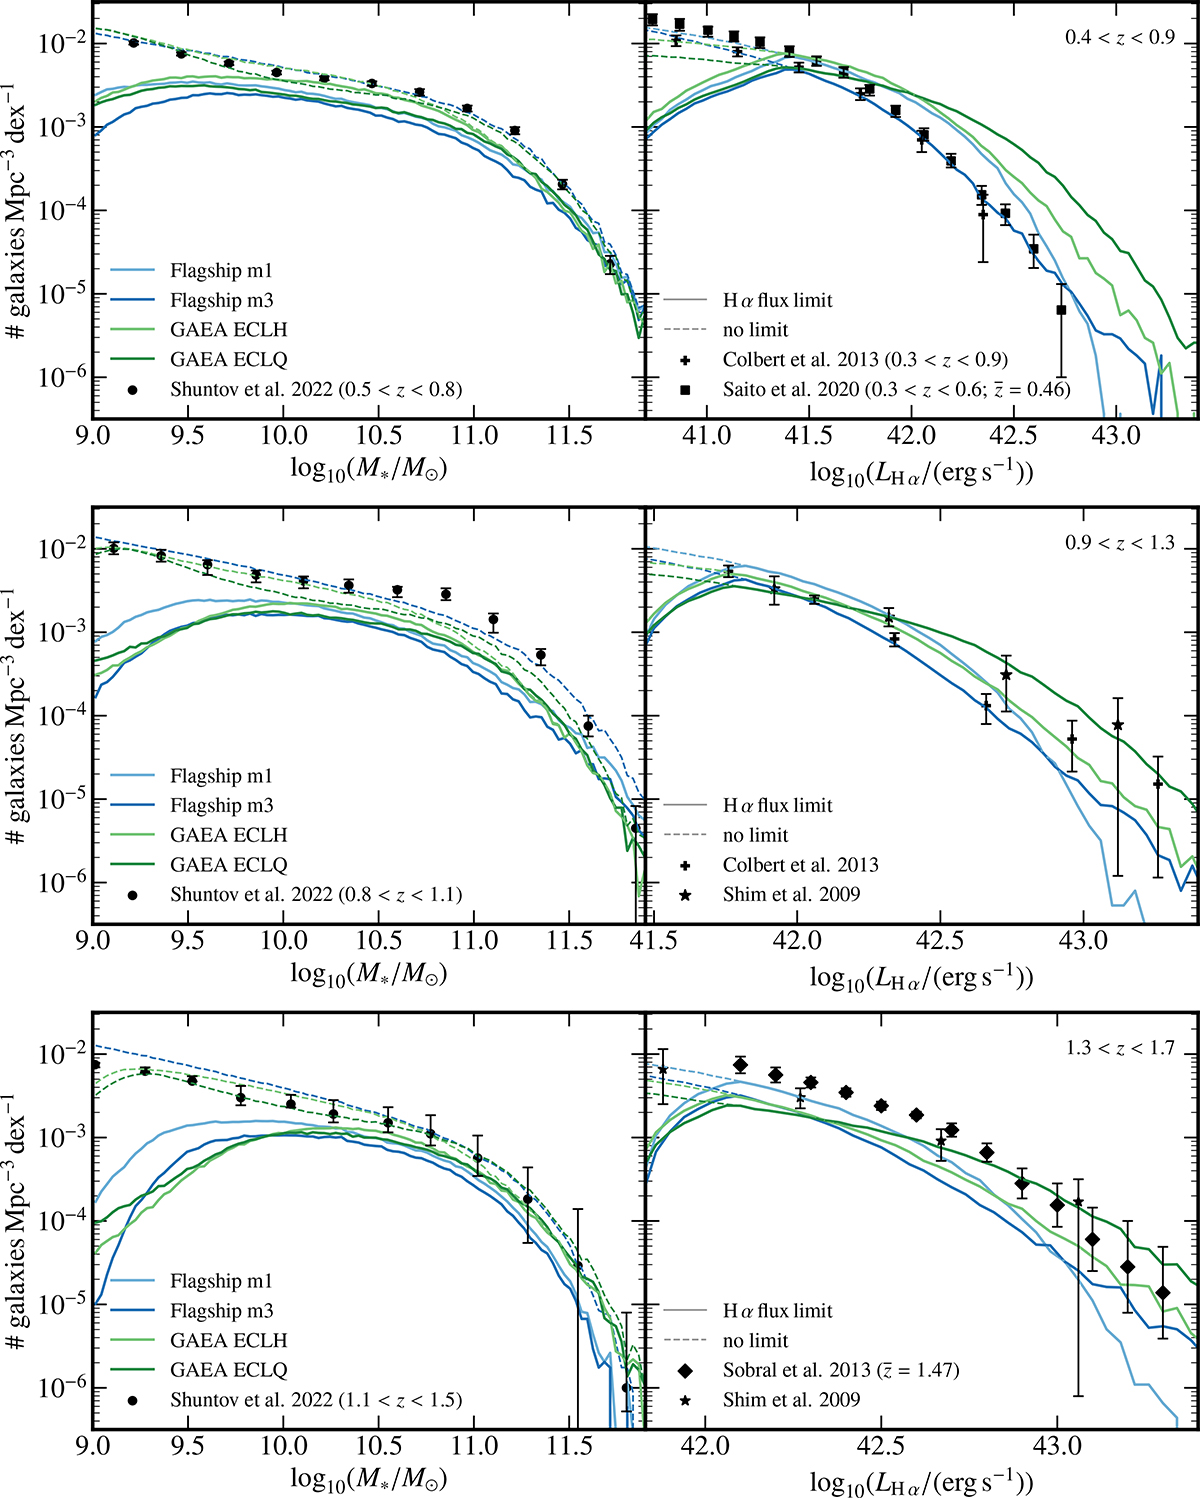
Download original image
Stellar mass (left) and Hα luminosity functions (right) in three redshift bins, 0.4 < z < 0.9 (top), 0.9 < z < 1.3 (middle), and 1.3 < z < 1.7 (bottom), in all models considered in this work for Hα flux limited samples (coloured solid lines) and for samples without any limit (coloured dashed lines). Black symbols correspond to observational data at these redshifts, COSMOS2020 (Shuntov et al. 2022) for stellar mass functions and the Emission Line COSMOS catalogue (Saito et al. 2020), HST-NICMOS (Shim et al. 2009), HST WISP (Colbert et al. 2013), and HiZELS (Sobral et al. 2013) for Hα luminosity functions.
Current usage metrics show cumulative count of Article Views (full-text article views including HTML views, PDF and ePub downloads, according to the available data) and Abstracts Views on Vision4Press platform.
Data correspond to usage on the plateform after 2015. The current usage metrics is available 48-96 hours after online publication and is updated daily on week days.
Initial download of the metrics may take a while.